


 914 1030

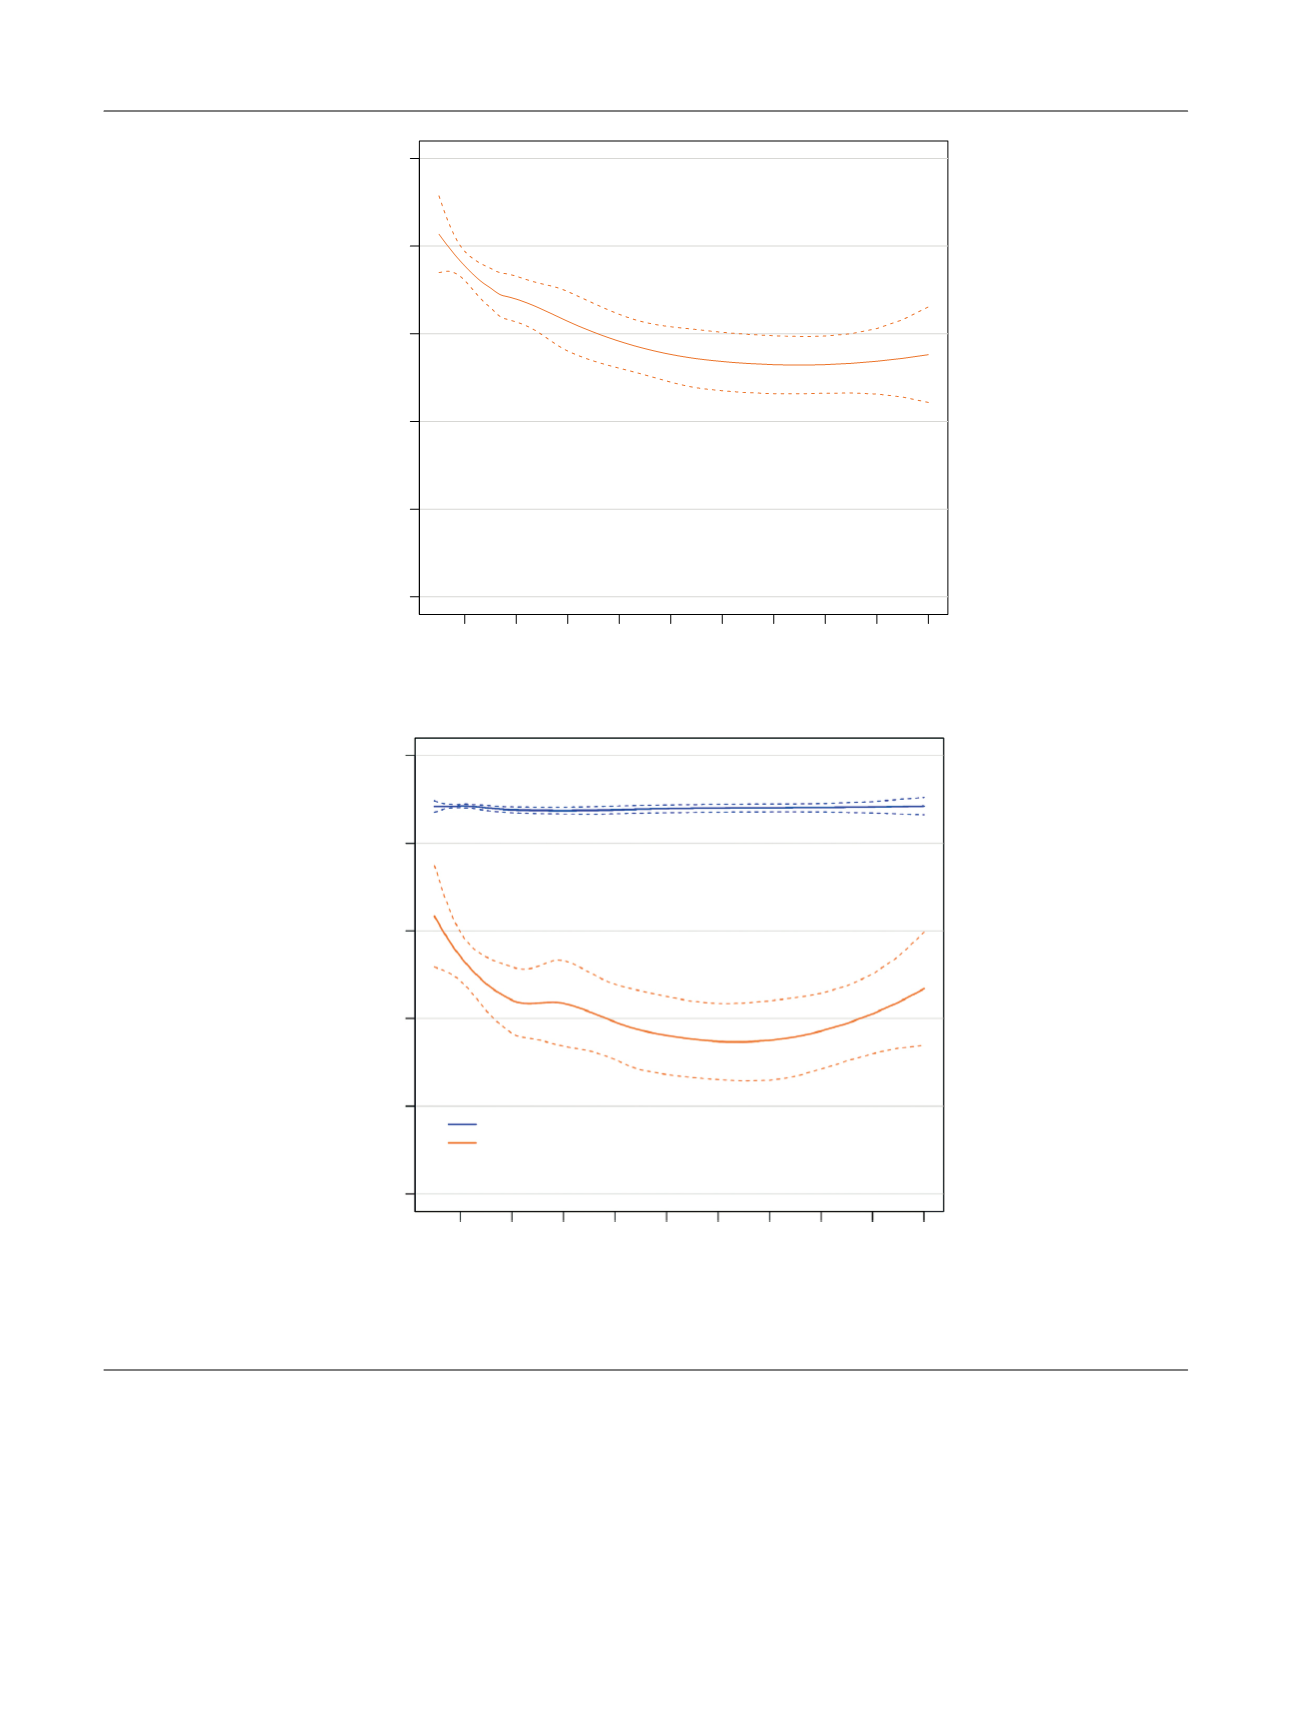
with lower CSM-free survival among men with a risk of CSM
of
<
10%
( Fig. 2 B).
3.4.
Association of postoperative RT with CSM
Supplementary Table 2 shows the results of multivariable
analyses predicting CSM in men who did not receive RT. The
coefficients to calculate the 10-yr risk of CSM are depicted in
Supplementary Table 3. The interaction test for the
hypothesis that the impact of postoperative RT on CSM
may vary according to the risk of CSM calculated on the
basis of a multivariable model that included pathologic
characteristics and receipt of immediate ADT was statisti-
cally significant (
p
= 0.001). The observed 10-yr CSM rates
were then plotted against the predicted probability of CSM
at 10-yr follow-up according to the administration of
[(Fig._2)TD$FIG]
First postoperative PSA (ng/ml)
10-yr CSM-free survival (%)
CSM-free survival at 10 yr (%)
0.2 0.4 0.6 0.8 1.0 1.2 1.4 1.6 1.8 2.0
First postoperative PSA (ng/ml)
0.2 0.4 0.6
10–yr CSM risk < 10%
10–yr CSM risk
≥
10%
0.8 1.0 1.2 1.4 1.6 1.8 2.0
50
60
70
80
90
100
a
b
50
60
70
80
90
100
Fig. 2 – Cancer-specific mortality (CSM) rates at 10-yr follow-up plotted against the PSA level at 6–8 wk after radical prostatectomy (A) in the overall
population and (B) after stratifying patients according to their nomogram-predicted 10-yr risk of CSM (<10% vs
I
10%). PSA = prostate-specific antigen.
E U R O P E A N U R O L O G Y 7 2 ( 2 0 1 7 ) 9 1 0 – 9 1 7
914