


 913 1030

noted a progressive decrease in 10-yr CSM-free survival
according to the level of the first PSA after surgery
( Fig. 2 A).
Interestingly, however, when patients were stratified
according to their predicted risk of CSM (
<
10% vs 10%),
the association between CSM-free survival and PSA at
6–8 wk differed by the risk of CSM and was evident only
among those with more aggressive disease. Conversely,
increasing PSA levels at 6–8 wk after RP were not associated
Table 2 – Multivariable Cox regression analyses evaluating the risk of cancer-specific mortality in 496 patients treated with radical
prostatectomy and extended pelvic lymph node dissection, who experienced postoperative prostate-specific antigen persistence
Univariable analyses
Multivariable analyses
HR (95% CI)
p
value
HR (95% CI)
p
value
Age at surgery
1.03 (0.98–1.07)
0.2
–
–
Pathologic grade group
3
1 (Ref.)
<
0.001
1 (Ref.)
0.01
4
4.37 (2.44–7.72)
2.72 (1.43–5.14)
Pathologic tumor stage
T2-pT3a
1 (Ref.)
<
0.001
1 (Ref.)
0.01
T3b/4
4.04 (2.29–7.09)
2.34 (1.21–4.49)
Pathologic nodal status
Negative
1 (Ref.)
<
0.001
1 (Ref.)
0.4
Positive
3.23 (1.71–6.11)
1.44 (0.66–3.12)
Positive surgical margins
No
1 (Ref.)
0.01
1 (Ref.)
0.3
Yes
2.06 (1.13–3.68)
1.36 (0.72–2.56)
Receipt of immediate ADT
2.97 (1.66–5.33)
<
0.001
1.27 (0.62–2.59)
0.5
HR = hazard ratio; CI = confidence interval; ADT = androgen deprivation therapy; Ref. = reference.
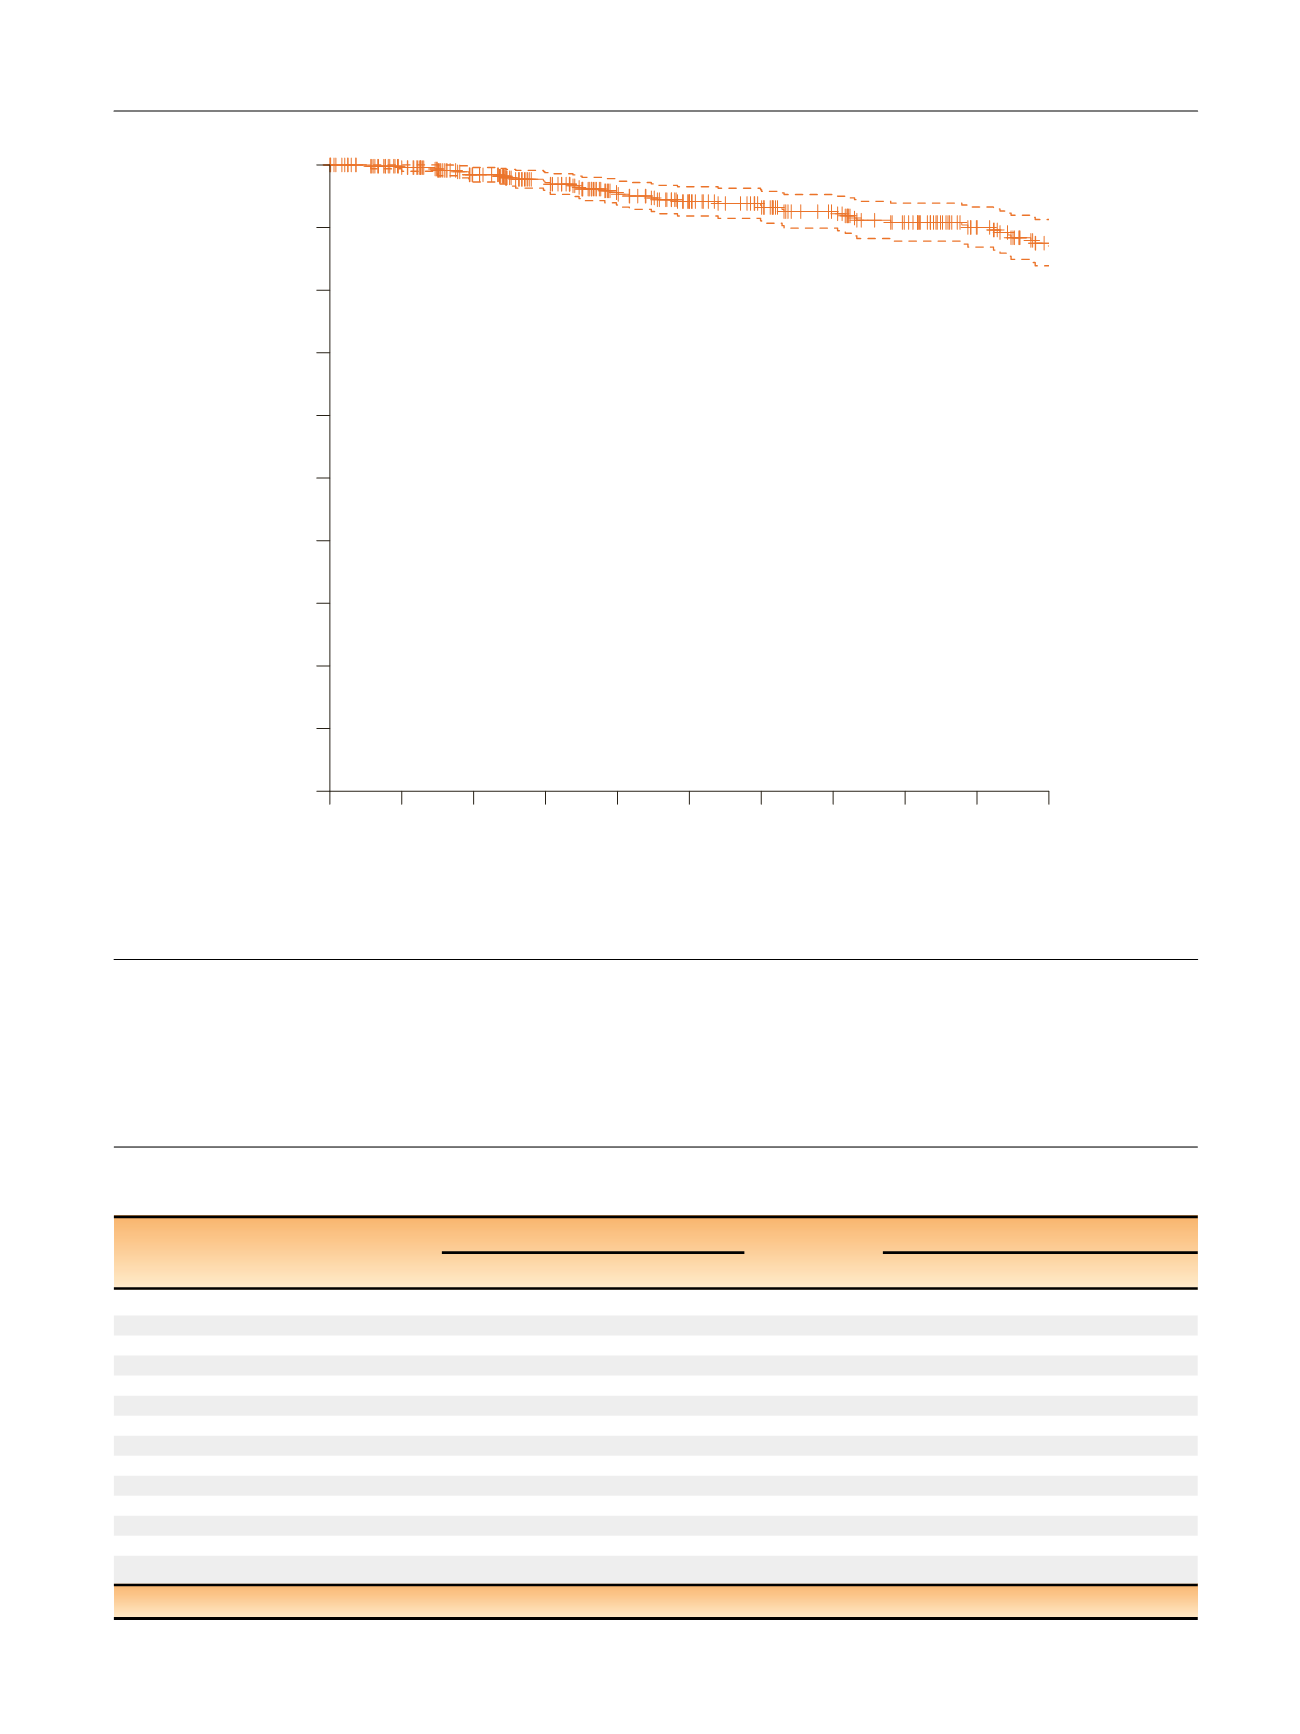
[(Fig._1)TD$FIG]
Survival
0.0 0.1 0.2 0.3 0.4 0.5 0.6 0.7 0.8 0.9 1.0
0
2
7
12
18
23
25
28
33
35
41
CE
496
460
419
381
341
314
293
274
253
225
199
NR
Time 0
12
24
36
48
60
72
84
96 108 120
Fig. 1 – Kaplan–Meier analyses assessing time to cancer-specific mortality in patients with PSA persistence after radical prostatectomy in the overall
population. PSA = prostate-specific antigen.
E U R O P E A N U R O L O G Y 7 2 ( 2 0 1 7 ) 9 1 0 – 9 1 7
913