


 878 1030

urinary irritation/obstruction scores, but with reduced QoL
related to bowel function and vitality. Patients treated with
EBRT plus ADT also reported CSD in sexual function.
Surprisingly, patients in the BT group reported significant
reductions in all QoL subdomain scores except vitality.
3.4.2.2. RP versus EBRT or AS.
Four studies
[23,24,26,28–30]reported QoL outcomes in men with localised PCa
undergoing RP or EBRT; however, in one
[29], authors did
not compare differences in QoL scores between treatments.
In the most recent update of the Prostate Cancer Outcomes
Study (PCOS)
[26], the authors compared QoL scores at 2, 5,
and 15 yr after primary therapy. Although men undergoing
RP had significantly higher rates of incontinence and
erectile dysfunction and lower rates of bowel urgency at
2 and 5 yr, these rates were similar to those in the EBRT
group at 15 yr. Barocas et al
[30]using the EPIC
questionnaire, reported that RP was associated with a
greater decrease in sexual function and urinary inconti-
nence than EBRT at 3 yr of follow-up. No clinically
meaningful differences existed in bowel function beyond
12 mo. The fourth study
[28]had a limited follow-up and
reported that men who underwent RP experienced signifi-
cant declines in urinary and sexual function when
compared with EBRT.
Regarding comparison of QoL outcomes between RP and
AS, Jeldres et al
[17]in a cohort of patients with low-risk PCa
reported similar results to ProtecT trial
[12], as at 3 yr of
follow-up, patients who underwent surgery had signifi-
cantly poorer urinary, sexual function, and sexual bother
scores.
3.4.2.3. BT versus RP or EBRT.
Four studies assessed QoL
outcomes in patients with localised PCa after BT or RP
[15,18–20]. Investigators in two studies
[18,20]included a
small number of patients with a limited follow-up of 12 mo
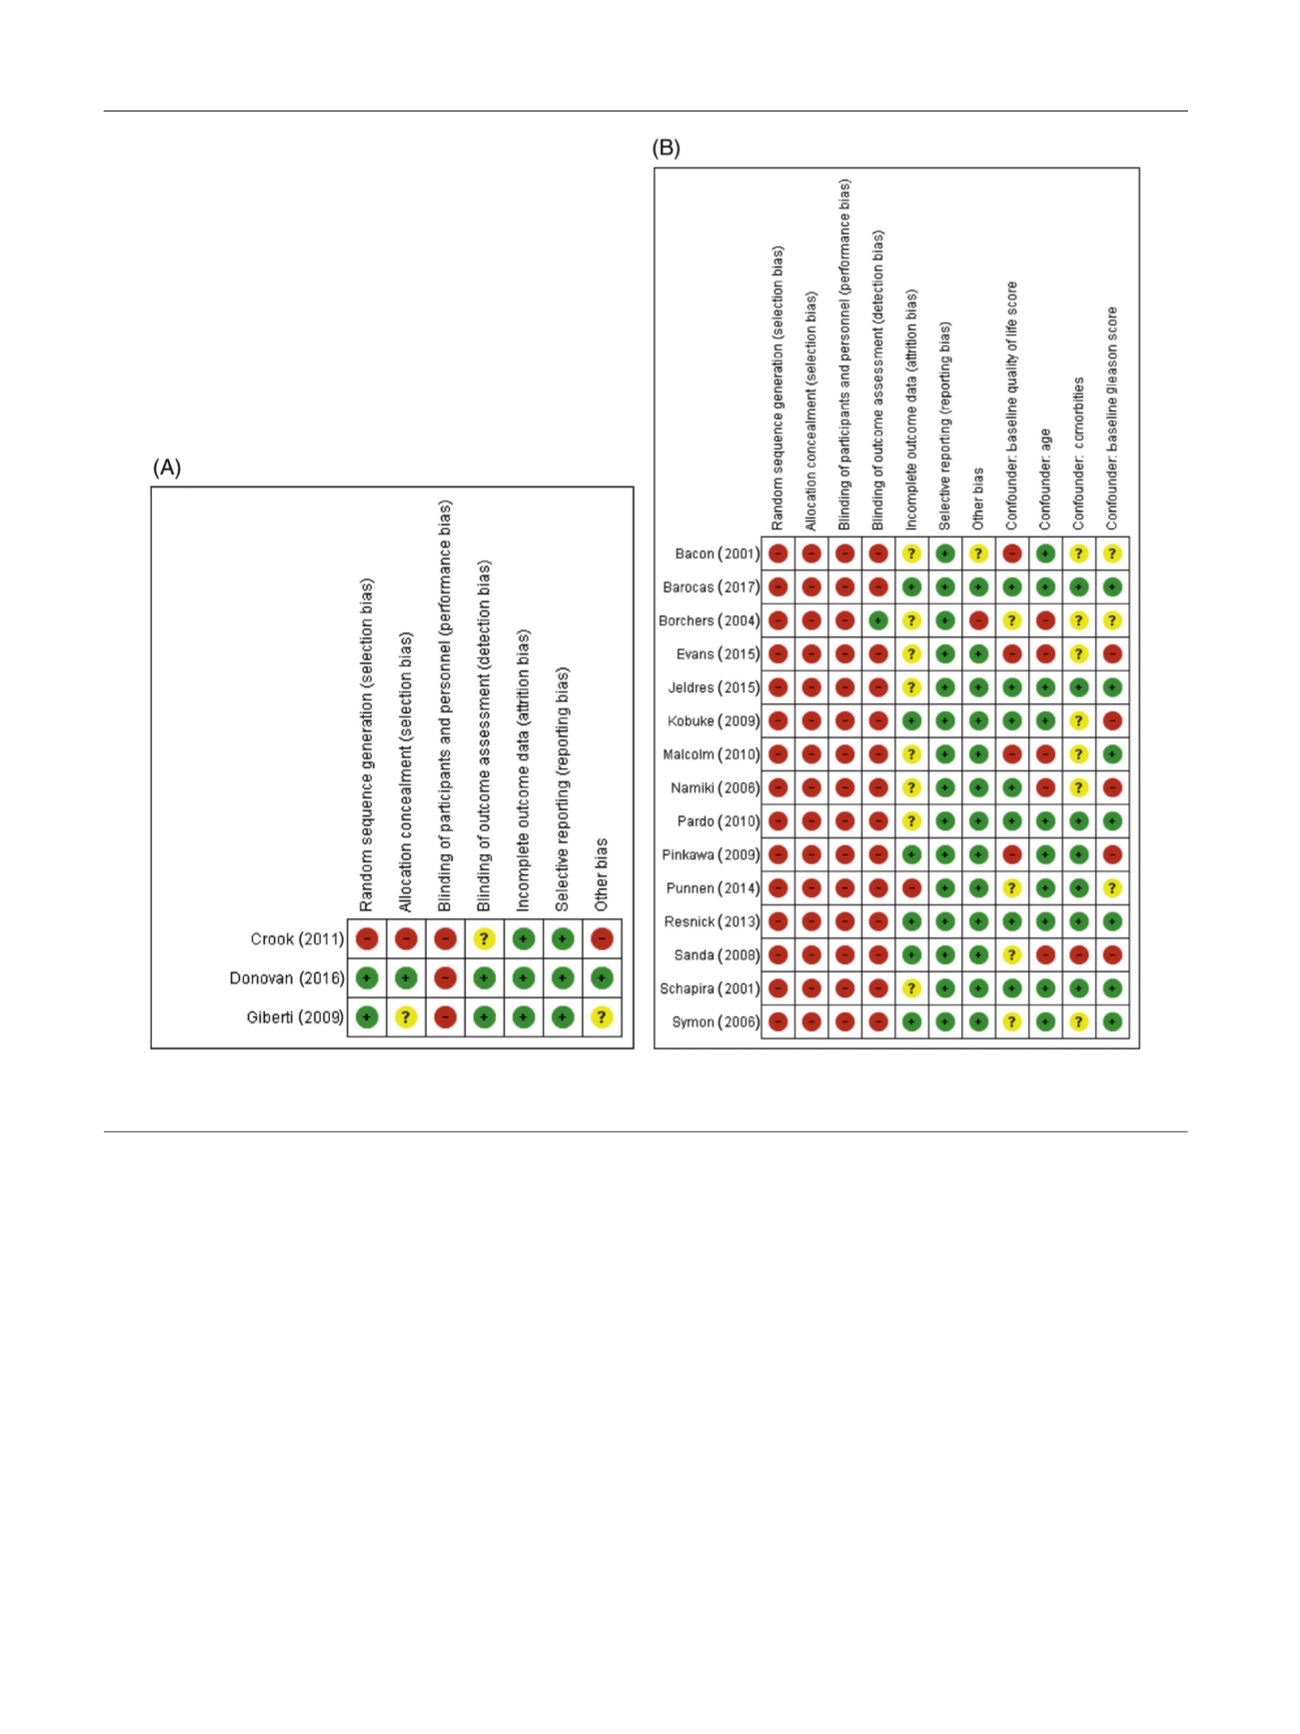
[(Fig._2)TD$FIG]
Fig. 2 – Risk of bias and confounder assessment for (A) RCTs and (B) nonrandomised prospective studies. Red colour indicates high RoB, yellow
uncertain RoB, and green low RoB. RCT = randomised controlled trial; RoB = risk of bias.
E U R O P E A N U R O L O G Y 7 2 ( 2 0 1 7 ) 8 6 9 – 8 8 5
878