


 1006 1030

hypogonadal men, men with or without baseline symp-
toms, and studies that used different instruments for
assessment
[16] .In addition, their interpretation of results
was not based on any stated criteria or validated statistical
method, and relied solely on their personal interpretation.
Strong additional supporting evidence for sexual benefits of
TTh comes from the Testosterone Trial, the largest
randomized controlled trial to date, which demonstrated
significant benefits in sexual activity, libido, and erectile
function
[37] .IIEF is the most widely used PRO in sexual medicine and
it was recommended by the International Consultation on
Sexual Medicine in 2004, 2010, and 2015 as the gold
standard for measuring EF
[21]. Using data from 17 RCTs
including 3345 patients treated with a PDE5i (tadalafil) or
placebo for 12 wk, Rosen et al (21) calculated the minimal
clinical important difference in the IIEF-EFD score. By
applying receiver operating characteristic curve analysis to
studies with tadalafil, they found that an increase of
4 points in IIEF-EFD score represents the best threshold for
the definition of a clinically relevant improvement in
comparison to placebo
[21]. When results were stratified
according to ED severity, the minimal clinical important
difference dropped down to 2. Interestingly, our data
showed that TTh was able to improve IIEF-EFD-score by
2.3 points, increasing to almost 3 points when a more severe
TD (TT
<
8 nmol/l) and random effect model were
considered. These data indicate that, in hypogonadal
[(Fig._4)TD$FIG]
Study name
A
B
Statistics for each study
Std diff in means and 95% CI
Lower
limit
Std diff
in means
p
value
Upper
limit
0,01
1,02
0,14
0,58
0,04
1,74
0,06
0,90
0,23
1,05
–0,26
0,40
0,18
1,05
–0,19
0,43
0,01
1,55
0,25
0,90
0,07
0,60
–0,02
0,29
0,00
2,79
1,21
2,00
0,59
0,37
–0,21
0,08
0,03
0,62
0,04
0,33
0,02
–0,08
–0,95
–0,51
0,00
0,95
0,38
0,67
0,00
0,43
0,11
0,27
0,00
0,47
0,12
0,30
–2,00 –1,00
0,00
1,00
2,00
Overall
0.32 0.24 0.41 0.001
Placebo TTh
Study name
Statistics for each study
Std diff in means and 95% CI
Upper
limit
Lower
limit
Std diff
in means
p
value
0,01
1,02
0,14
0,58
0,04
1,74
0,06
0,90
0,23
1,05
–0,26
0,40
0,18
1,05
–0,19
0,43
0,01
1,55
0,25
0,90
0,07
0,60
–0,02
0,29
0,00
2,79
1,21
2,00
0,59
0,37
–0,21
0,08
0,03
0,62
0,04
0,33
0,02
–0,08
–0,95
–0,51
0,00
0,95
0,38
0,67
0,00
0,43
0,11
0,27
0,00
0,47
0,12
0,30
–1,00 –0,50 0,00
0,50
1,00
Overall
0.41 0.21 0.60 0.001
Placebo TTh
Cavallini et al., 2004
Svartberg et al., 2004
Chaing et al., 2007
Allan et al., 2008
Chiang et al., 2009
Guilty et al., 2010
Aversa et al., 2010
Jones et al., 2011
Hackett et al., 2013
Gianatti et al., 2014
Basaria et al., 2015
Brock et al., 2016
Snyder et al., 2016
Cavallini et al., 2004
Svartberg et al., 2004
Chaing et al., 2007
Allan et al., 2008
Chiang et al., 2009
Guilty et al., 2010
Aversa et al., 2010
Jones et al., 2011
Hackett et al., 2013
Gianatti et al., 2014
Basaria et al., 2015
Brock et al., 2016
Snyder et al., 2016
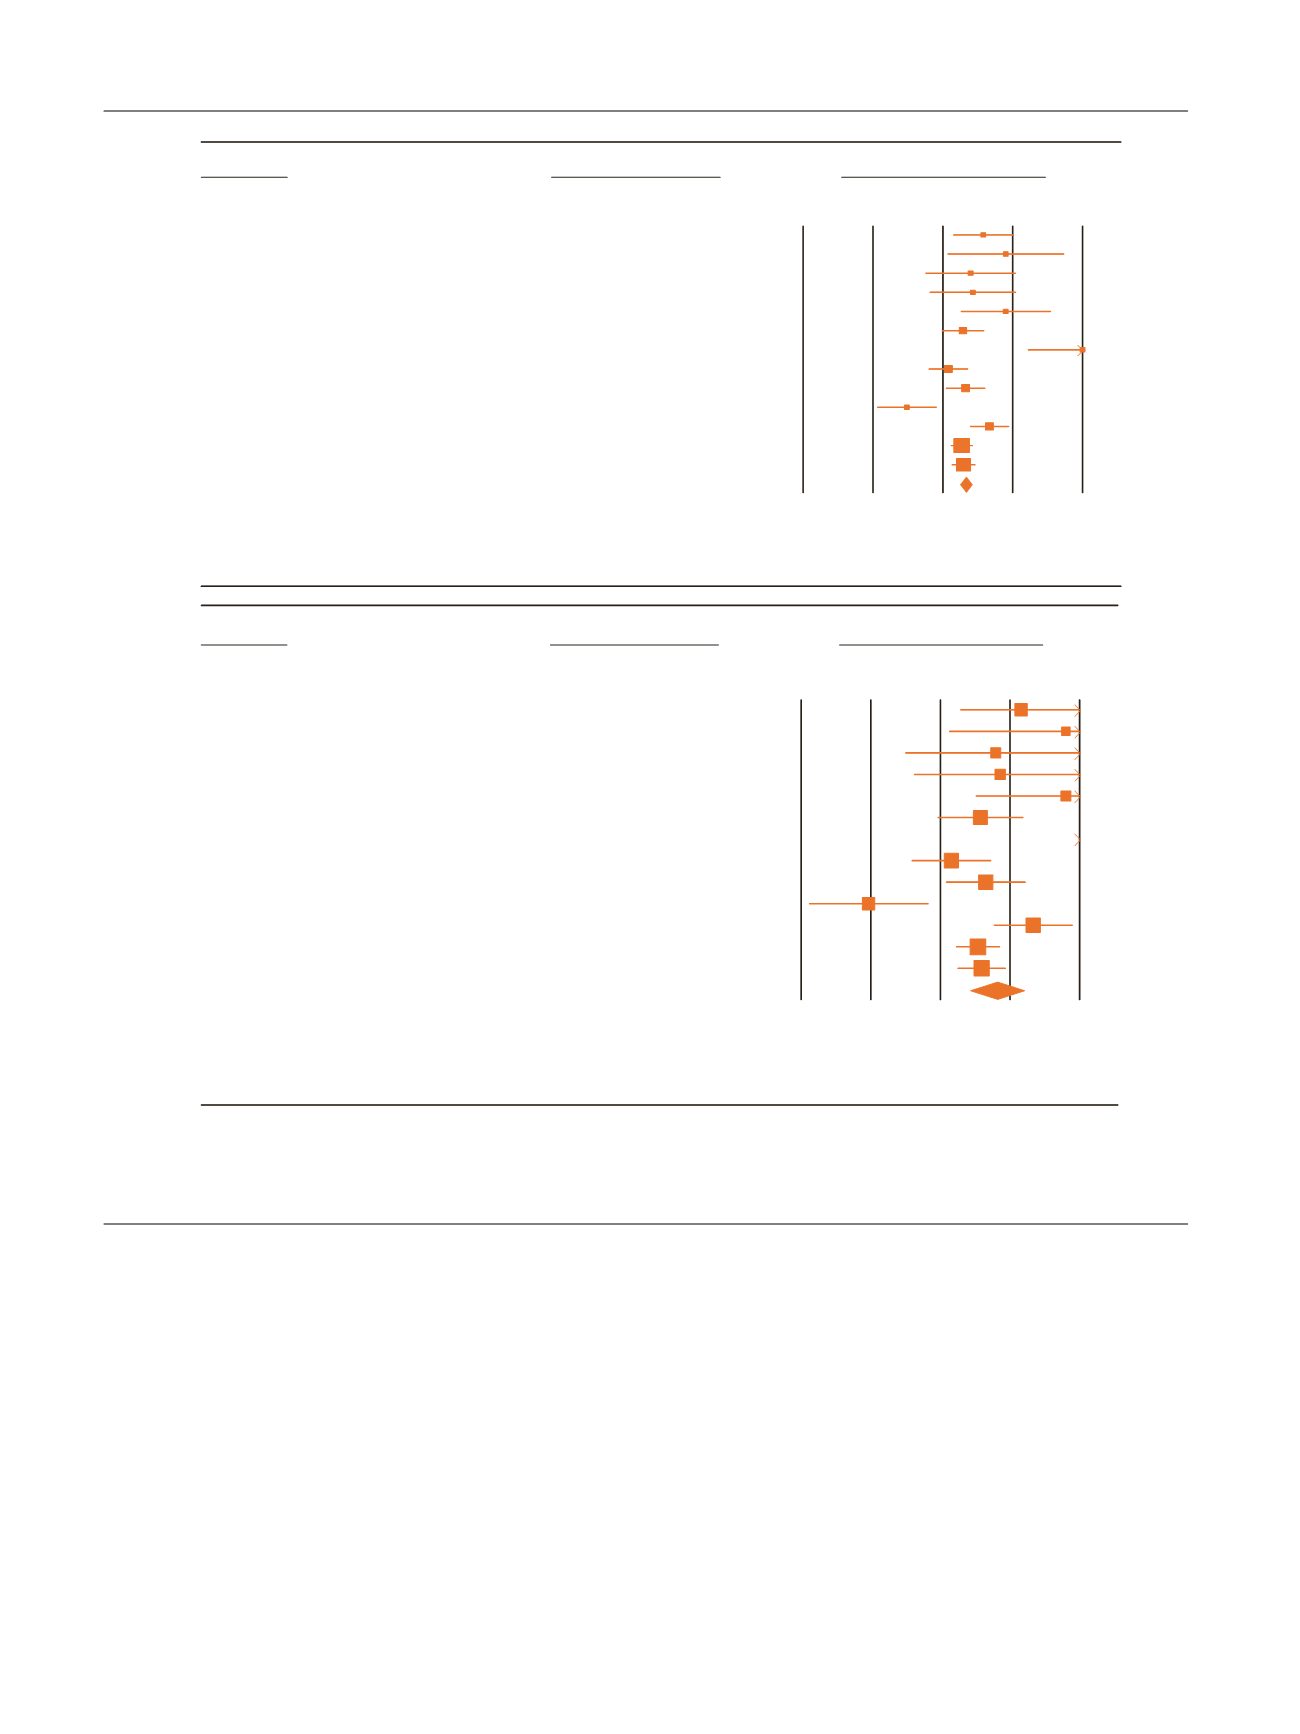
Fig. 4 – Effect size (with 95% confidence interval [CI]) of testosterone treatment (TTh) versus placebo on erectile function component (including
studies using International Index of Erectile Function (IIEF)-erectile function domain or IIEF-5 score as possible outcome) as derived by applying fixed
(A) or random (B) models.
Std diff = standard difference.
E U R O P E A N U R O L O G Y 7 2 ( 2 0 1 7 ) 1 0 0 0 – 1 0 1 1
1006