
3.1.2.
EF component
Data on the effect of TTh on EF, including IIEF-EFD or IIEF-5
score (EF component), were available in 10 and four studies,
respectively
( Table 1 ). I
2
was 74.4 (
p
<
0.0001). The Begg-
adjusted rank correlation test (Kendall tau 0.37,
p
= 0.08),
based on TTh versus placebo on EF component, suggested
no major publication bias.
Overall, the combined data for IIEF-EFD and IIEF-5 score
showed that TTh provided a significant improvement of the
EF component as compared with placebo (SDM =
0.32 [0.28;0.41],
p
<
0.0001;
Fig. 4 ,panel A). The results
were confirmed even when random effect was considered
(SDM = 0.41 [0.21;0.60],
p
<
0.0001;
Fig. 4, panel B). Meta-
regression analysis showed that the effect of TTh was lower
in those studies with a higher prevalence of diabetes
mellitus or a higher body mass index at enrolment, and
increased as a function of trial duration
( Fig. 5, panels A–C).
Interestingly, by applying the formula derived from meta-
regression analysis, we found that the estimated EF
component with TTh was already significantly different
from placebo after 3 mo of therapy (SMD = 0.23
[0.09;0.49]). The improvement in overall EF component
was unaffected by mean age (S = 0.005 [–0.008;0.017],
p
= 0.47 and I = 0.033 [–0.740;0.806],
p
= 0.93), mean
baseline total T (S = 0.035 [–0.009;0.078],
p
= 0.12 and
I = 0.040 [–0.331;0.412],
p
= 0.83) or mean baseline IIEF
score (S = 0.014 –0.010;0.038],
p
= 0.26 and I = 0.149
[–0.171;0.468],
p
= 0.36). There was no significant difference
between trials enrolling subjects having TT
<
12 nmol/L or
TT
<
8 nmol/L at baseline (Q = 0.41,
p
= 0.52). The negative
association between overall TTh-induced EF improvement
and diabetes was confirmed in a multivariate regression
model, after adjusting for body mass index, age, trial
duration, and mean T at enrolment (adjusted r
2
= –0.128
and –0.128, both
p
<
0.0001 for fixed and random models,
respectively).
I
2
calculated when only trials using IIEF-EFD as the
outcome were considered was 43.3 (
p
= 0.12). A sensitivity
analysis restricted to the latter trials confirmed the positive
effect of TTh in improving EF as compared with placebo
either when fixed or random models were applied
( Fig. 6, panels A and B; Supplementary Fig. 1, panels A
and B). Accordingly, patients with more severe hypogonad-
ism (TT
<
8 nmol/l) as an inclusion criterion reported
greater changes in final IIEF-EFD score when compared with
those with a milder form of T deficiency (TT
<
12 nmol/L;
1.47 [0.90;2.03] and 2.95 [1.86;4.03] for total T
<
12 nmol/l
and 8 nmol/l, respectively; Q = 5.61,
p
= 0.02 and
1.47 [0.90;2.03] and 2.95 [1.86;4.03] for total T
<
12 nmol/l and 8 nmol/l, respectively; Q = 5.61,
p
= 0.02,
for fixed and random models, respectively;
Fig. 6, panels A
and B). Similar results were observed when the effects of
TTh over placebo on EF were expressed as a percentage
change in the maximum IIEF-EFD score as derived by
applying either fixed or random models (Supplementary
Fig. 2).
3.1.3.
Other sexual function components
Data on the effect of TTh on IIEF-libido, intercourse
satisfaction, and overall sexual satisfaction domains were
available in six studies, including 1269 individuals total.
Overall, TTh resulted in an improvement of IIEF-desire,
intercourse, and overall sexual satisfaction domains,
whether the fixed or random models were applied
( Fig. 6 ,panels A and B; Supplementary Fig. 1, panels C–H).
Data on the effect of TTh on IIEF-orgasmic domain were
available in seven studies, including 1300 individuals. Even
in this group, TTh determined a significant improvement
over placebo both when fixed or random models were
applied
( Fig. 6, panels A and B; Supplementary Fig. 1,
panels I–L). The data were confirmed when one study
(Poudch et al., 2015) which included a mixed population of
patients with premature and delayed ejaculation was
excluded from the analysis
( Fig. 6 ,panels A and B).
Finally, data on IIEF-15 total score was available in four
studies enrolling 607 patients. When compared with
placebo, TTh resulted in a significant positive effect both
when fixed or randommodels were applied
( Fig. 6 ,panels A
and B; Supplementary Fig. 1, panels M–N).
Similar results were observed when the effects of
TTh over placebo on the different IIEF-subdomains
were expressed as a percentage change in the maximum
[(Fig._2)TD$FIG]
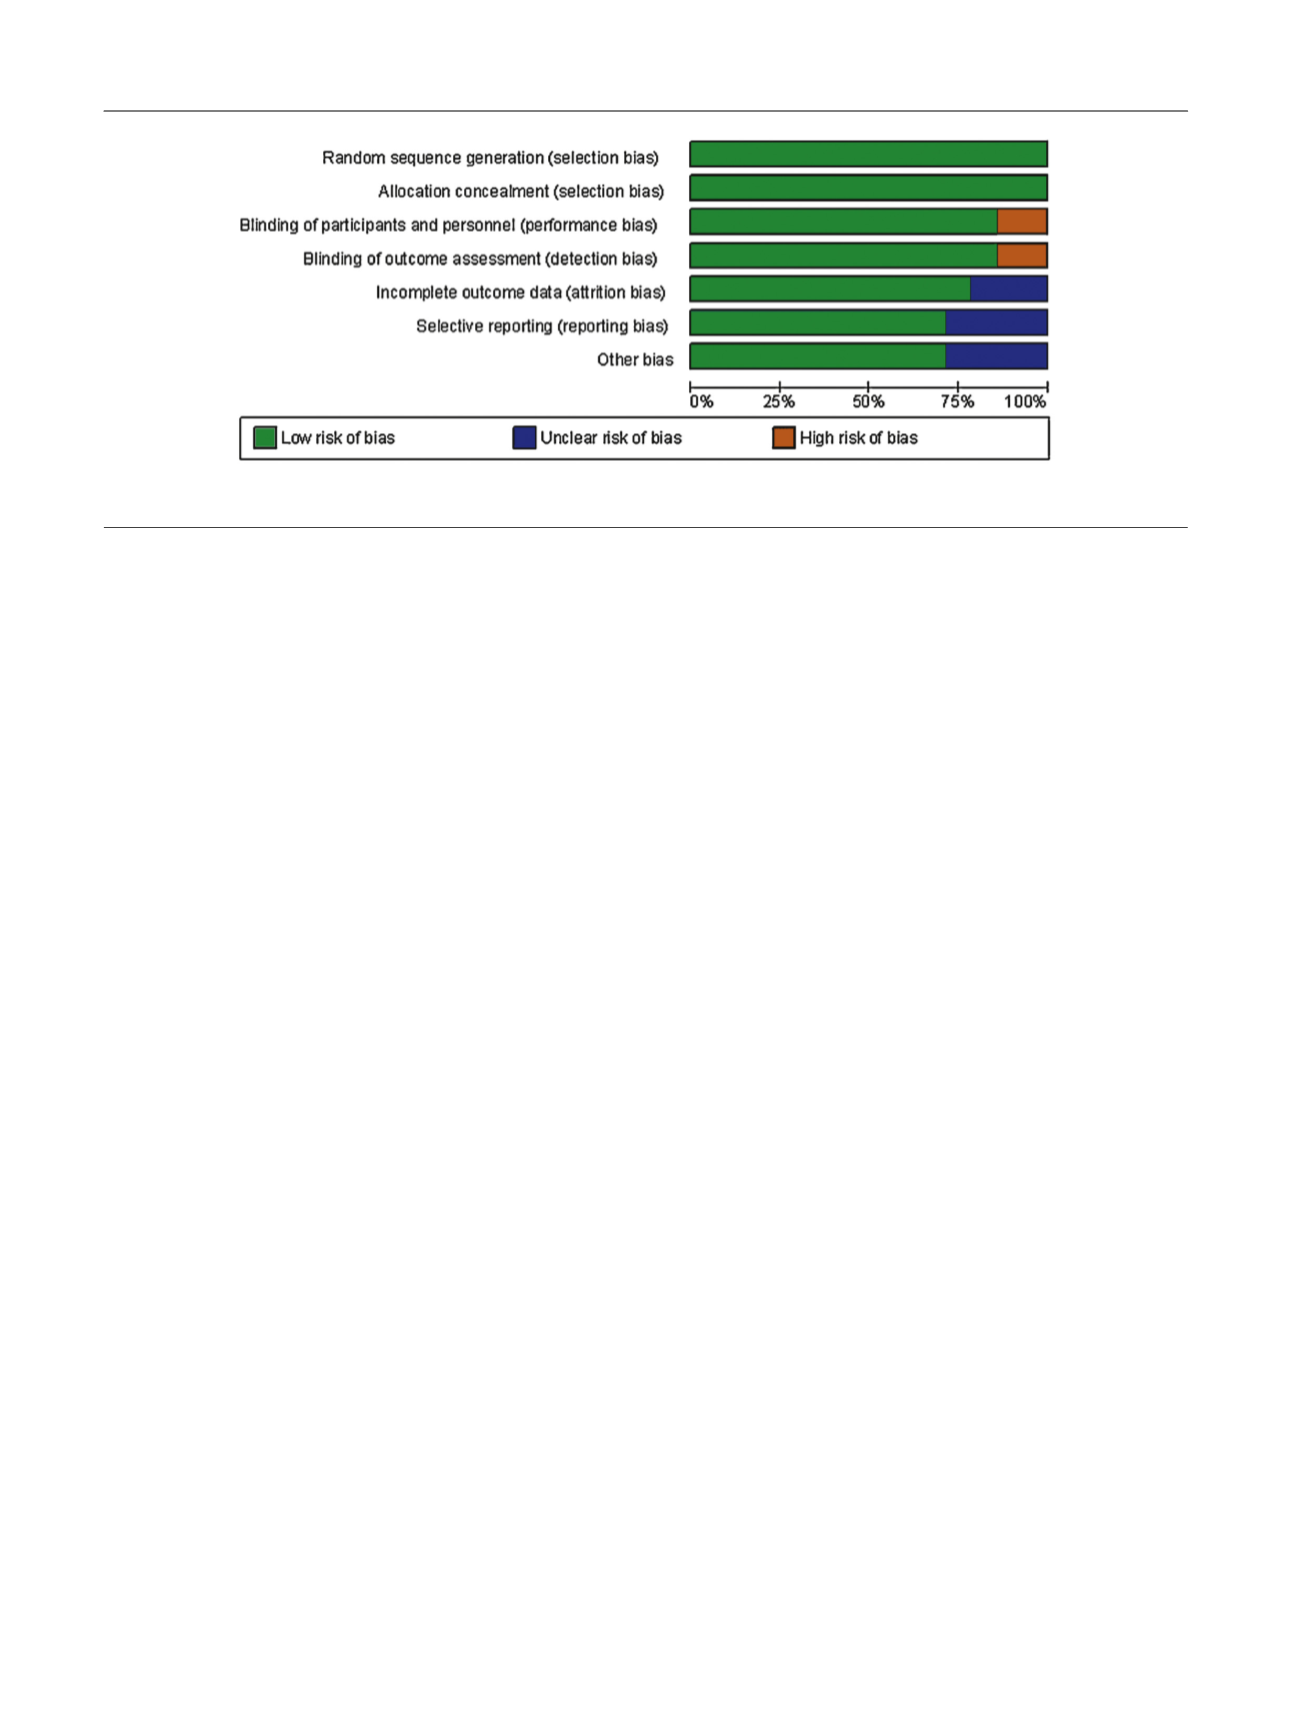
Fig. 2 – Methodology quality graph: review author’s judgments about each methodology quality item presented as percentage across all studies.
E U R O P E A N U R O L O G Y 7 2 ( 2 0 1 7 ) 1 0 0 0 – 1 0 1 1
1004


