


 1007 1030

[(Fig._5)TD$FIG]
0
14.88 32.16 49.44 66.72 84.00 101.28 118.56 135.84 153.12 170.40
2.00
1.74
1.48
1.22
0.96
0.70
0.44
0.18
–0.08
–0.34
–0.60
Trial follow up (wk)
S = 0.0023 [0.0001. 0.046],
p
= 0.045
I = 0.2237 [0.0931. 0.3543],
p
< 0.001
C
23.66 24.64 25.63 26.62 27.60 28.59 29.58 30.56 31.55 32.54 33.52
2.00
1.74
1.48
1.22
0.96
0.70
0.44
0.18
–0.08
–0.34
–0.60
BMI (kg/m
2 )
S = -0.099 [–0.157. –0.041],
p
< 0.001
I = 3.344 [1.545. 5.142],
p
< 0.0001
B
2.00 14.00 26.00 38.00 50.00 62.00 74.00 86.00 98.00 110.00
2.00
1.74
1.48
1.22
0.96
0.70
0.44
0.18
–0.08
–0.34
–0.60
Effect size
EF component
Effect size
EF component
Effect size
EF component
S =
−
0.006 [–0.009. –0.003],
p
< 0.0001
I = 0.577 [0.412. 0.743],
p
< 0.0001
DM (%)
0
A
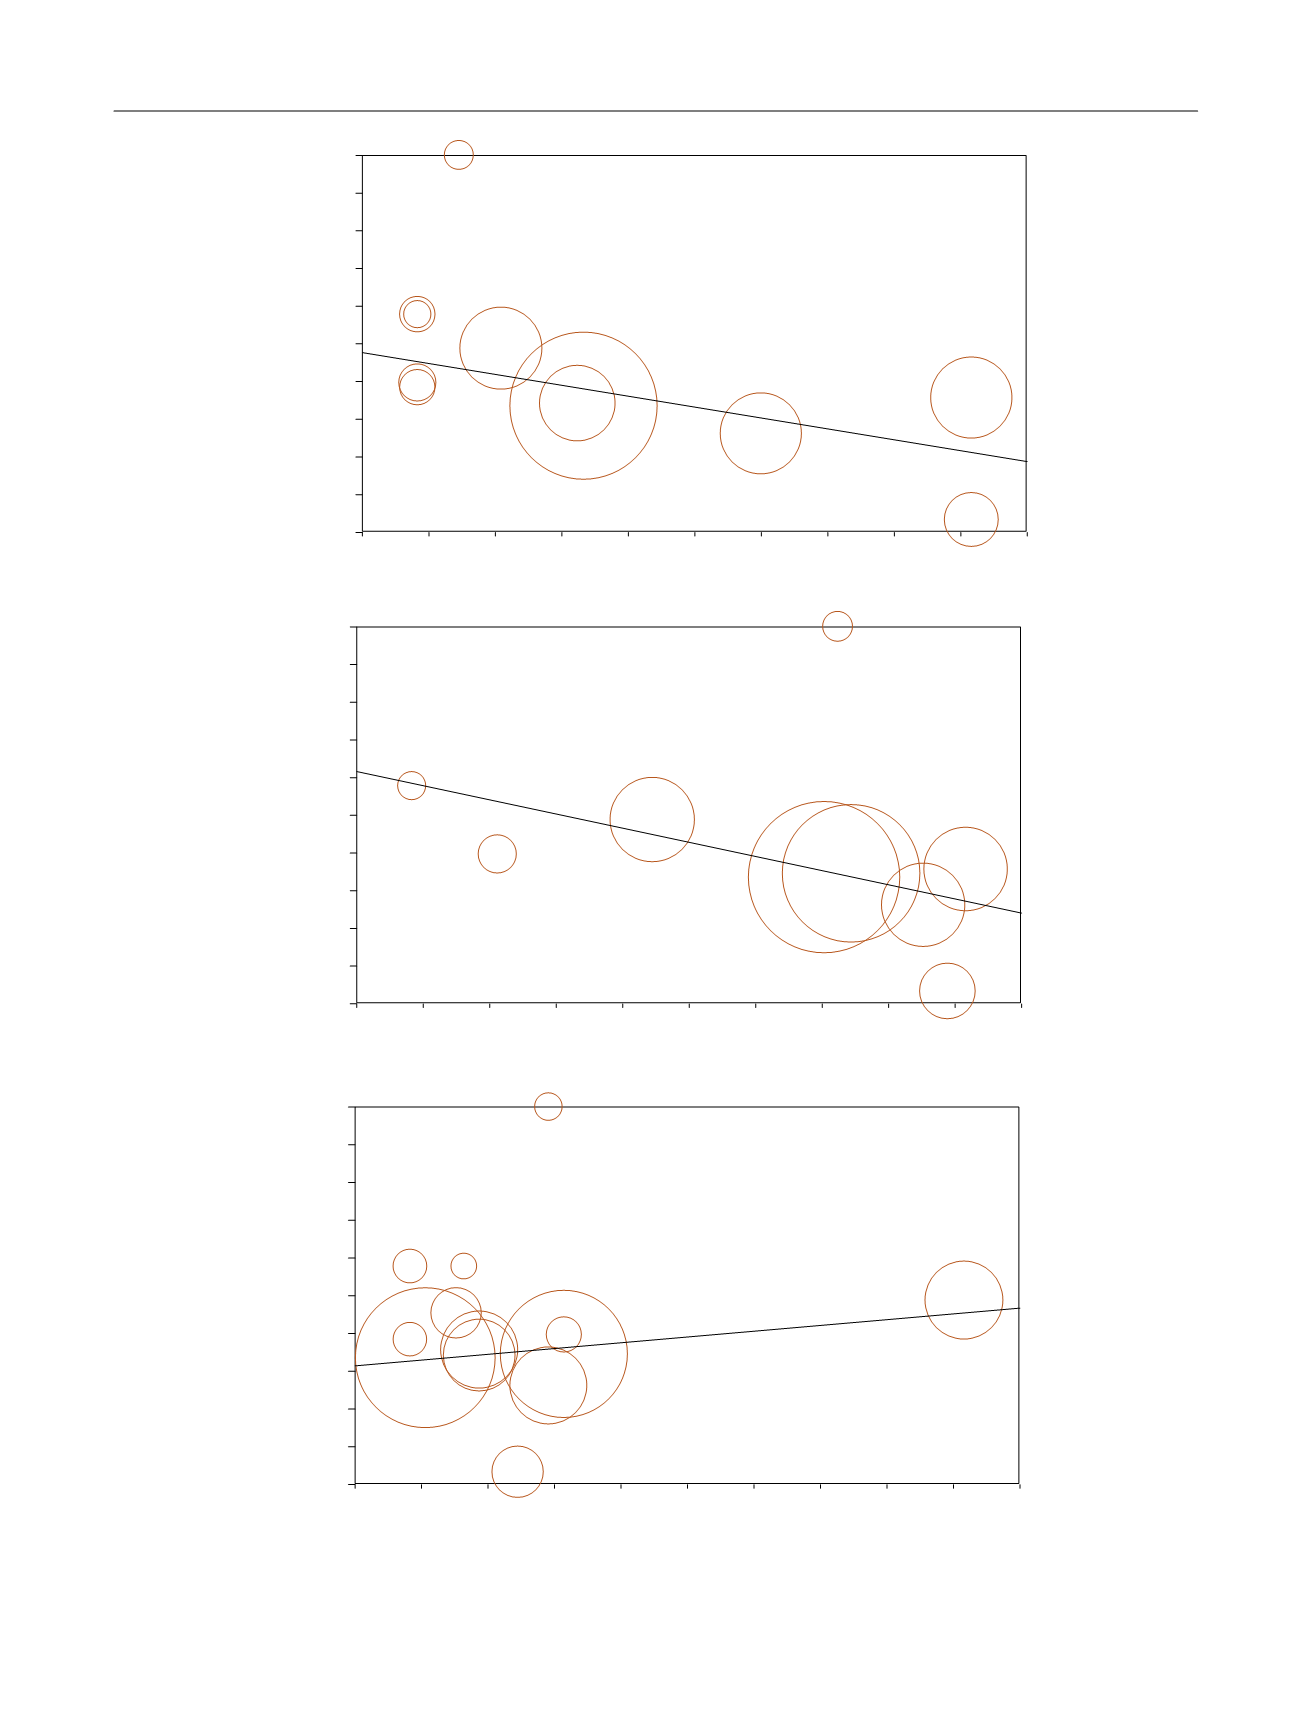
Fig. 5 – Influence of (A) diabetes mellitus (DM) and (B) body mass index (BMI) at (C) enrolment and trial duration on erectile function (EF)
improvement. The size of the circles indicates sample dimension.
E U R O P E A N U R O L O G Y 7 2 ( 2 0 1 7 ) 1 0 0 0 – 1 0 1 1
1007