


 967 1030

[(Fig._3)TD$FIG]
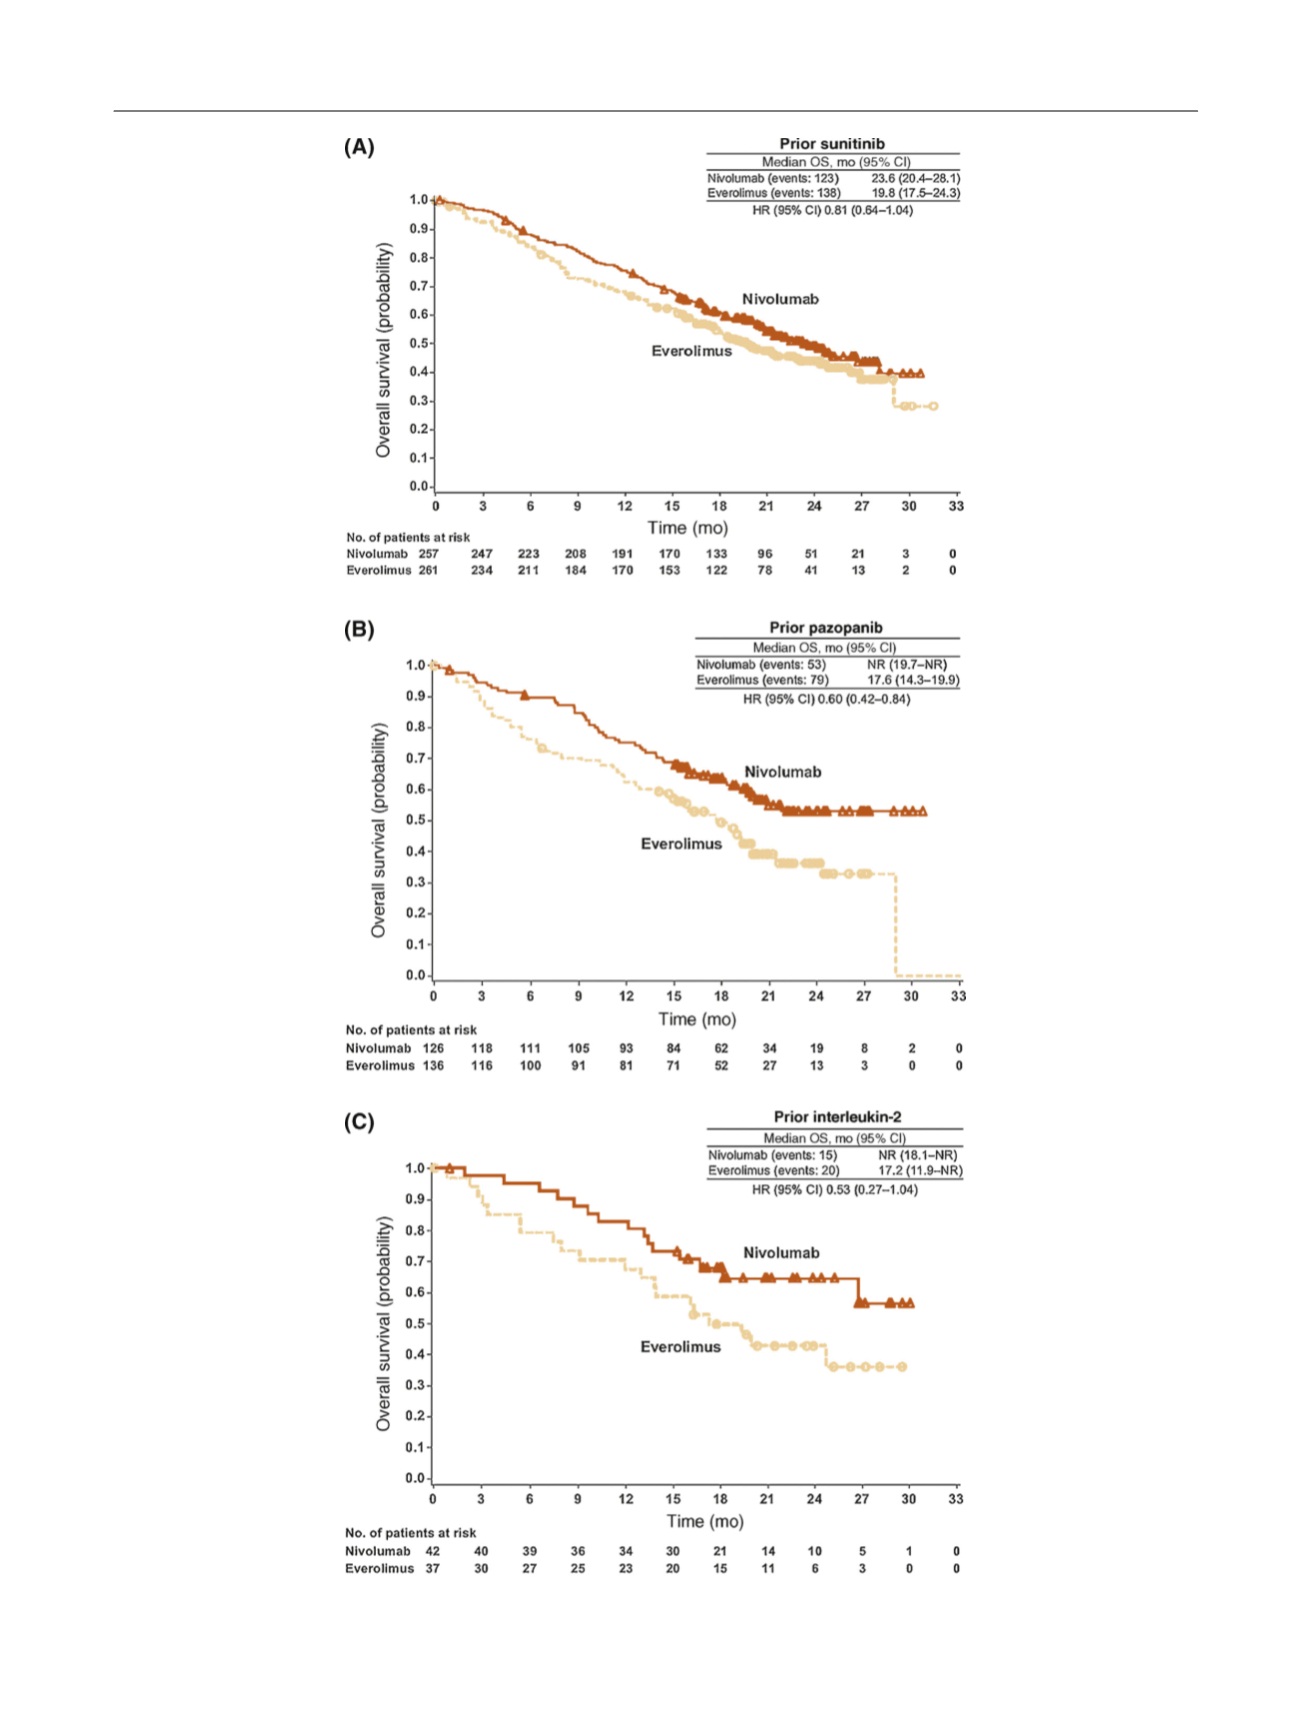
Fig. 3 – Kaplan-Meier curves for overall survival by (A) prior sunitinib therapy, (B) prior pazopanib therapy, and (C) prior interleukin-2 therapy.
CI = confidence interval; HR = hazard ratio; NR = not reached; OS = overall survival.
E U R O P E A N U R O L O G Y 7 2 ( 2 0 1 7 ) 9 6 2 – 9 7 1
967