


 968 1030

18.3 mo (95% CI 13.4–26.7) with nivolumab and 16.0 mo
(95% CI 8.4–21.6) with everolimus (Supplementary Fig. 4B;
Fig. 1A). Median OS in patients with lung metastases was
25.0mo (95% CI 20.4–NR) with nivolumab and 18.7mo (95%
CI 16.2–21.2) with everolimus (Supplementary Fig. S4C, Fig.
1A).
3.5.
OS by prior therapy
Median OS in patients with prior sunitinib or pazopanib or
interleukin-2 therapy was longer with nivolumab than with
everolimus or was not yet reached for nivolumab
( Fig. 3,
Fig. 1A; reported previously for sunitinib and pazopanib in
the nivolumab arm
[14] ).
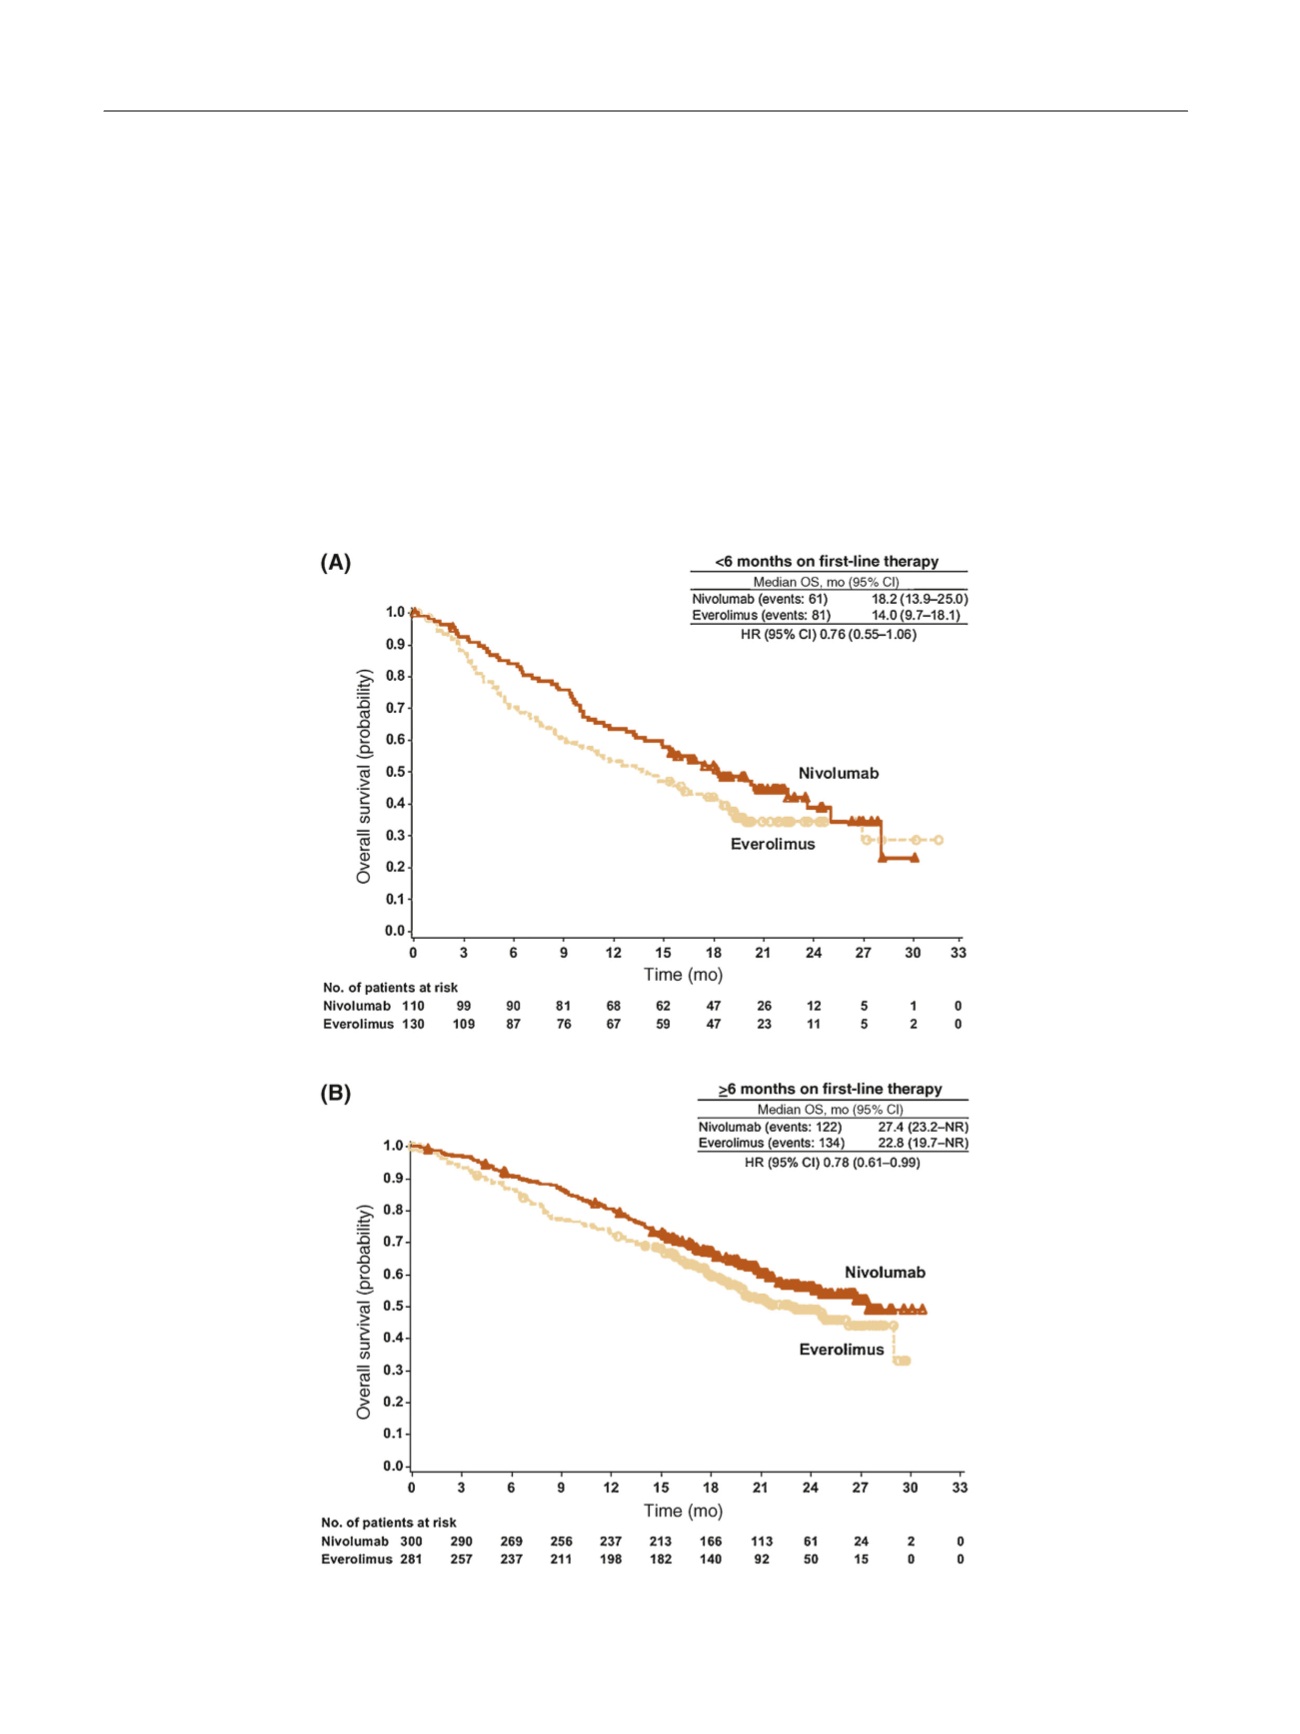
When the overall treated population was divided
according to
[2_TD$DIFF]
first-line therapy duration, median OS was
longer for both treatment arms in patients with 6 mo
compared
[4_TD$DIFF]
with
<
6 mo on first-line therapy and was
longer with nivolumab compared
[4_TD$DIFF]
with everolimus
( Fig. 4 , Fig. 1 A).
Median OS in patients with one prior antiangiogenic
therapy was 23.6 mo (95% CI 20.8–NR) with nivolumab and
19.9 mo (95% CI 17.7–24.7) with everolimus
( Fig. 1 A).
3.6.
Interaction test for each subgroup
An interaction test of treatment and each subgroup with OS
revealed a significant interaction for MSKCC risk group
[(Fig._4)TD$FIG]
Fig. 4 – Overall survival by first-line therapy duration of (A) <6 mo and (B)
I
6 mo. CI = confidence interval; HR = hazard ratio; NR = not reached;
OS = overall survival.
E U R O P E A N U R O L O G Y 7 2 ( 2 0 1 7 ) 9 6 2 – 9 7 1
968