


 966 1030

[(Fig._2)TD$FIG]
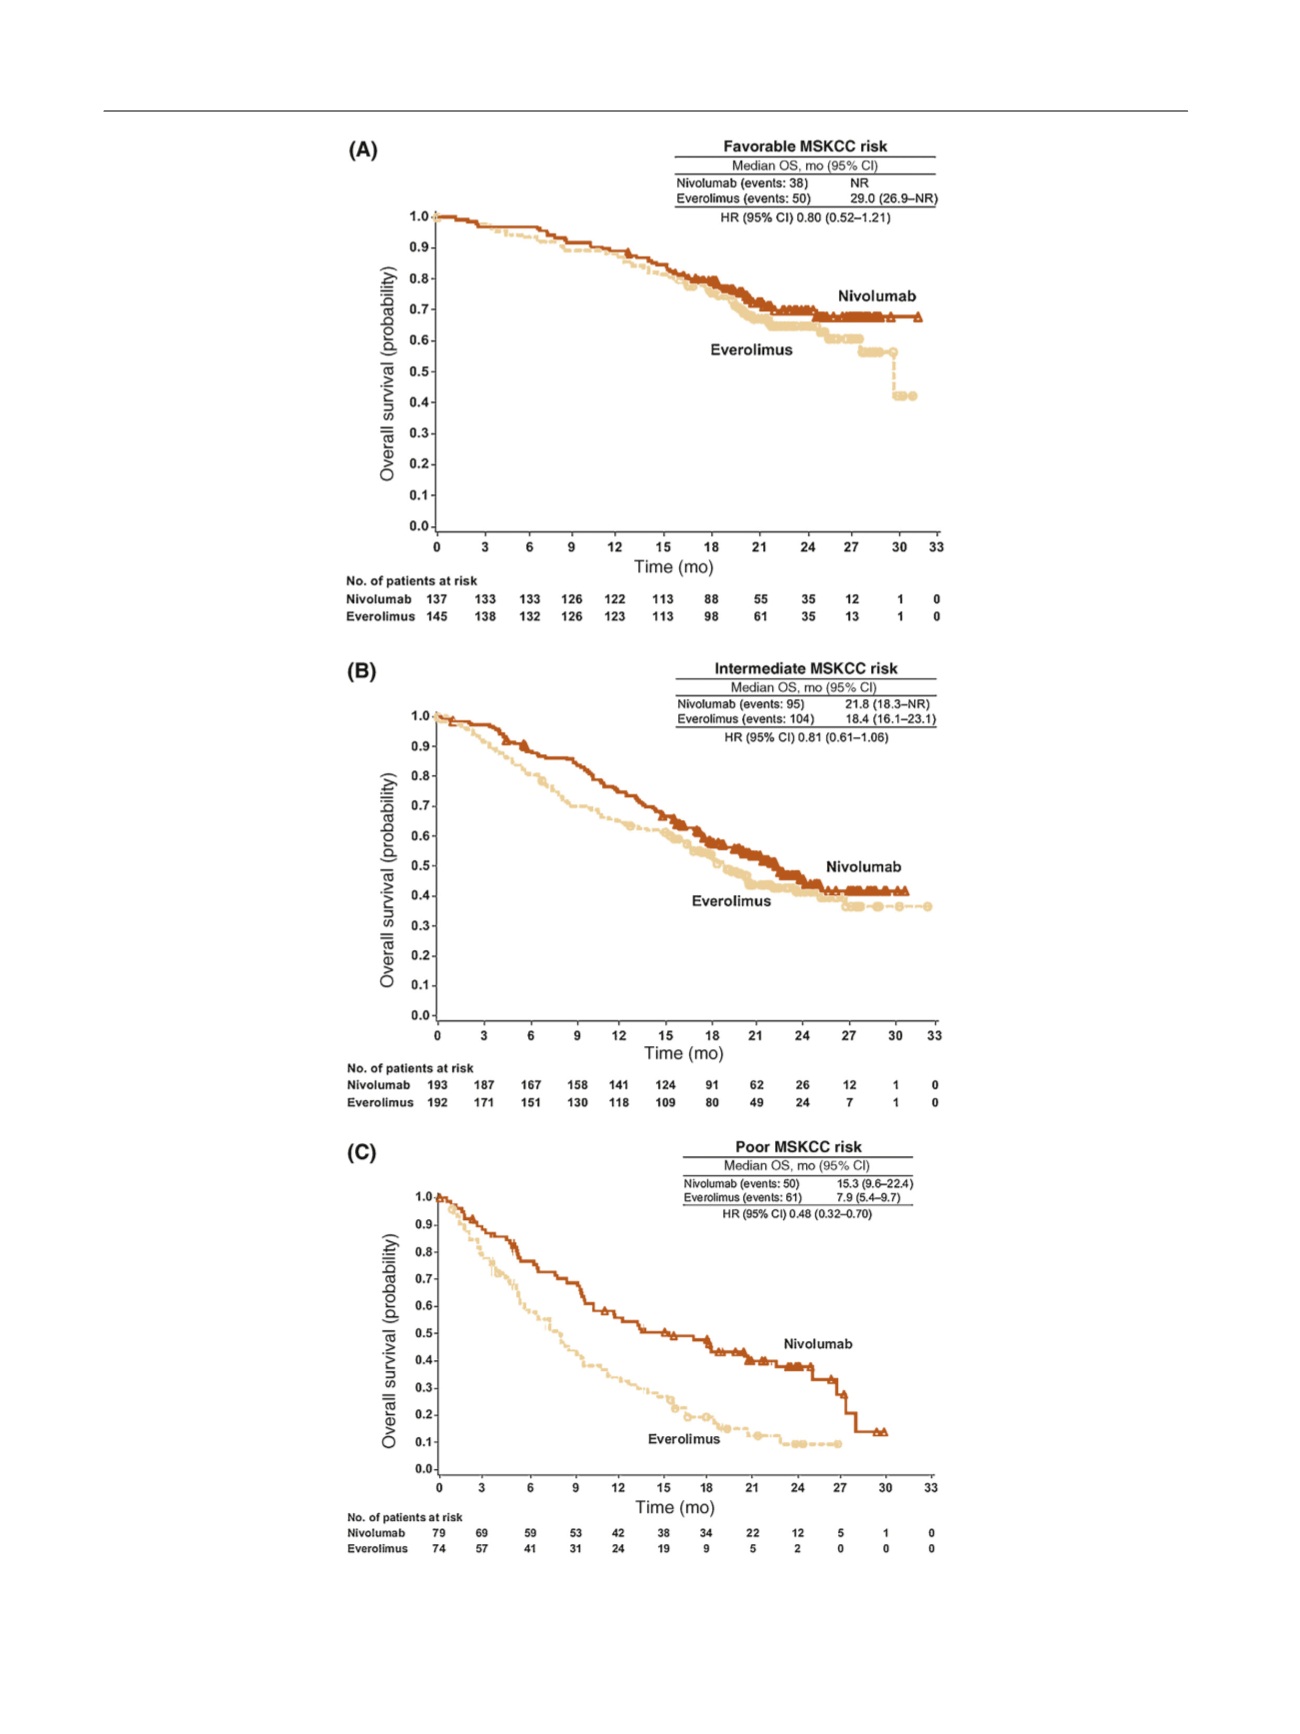
Fig. 2 – Kaplan-Meier curves for overall survival by (A) favorable, (B) intermediate, and (C) poor MSKCC risk group. CI = confidence interval; HR = hazard
ratio; MSKCC = Memorial Sloan Kettering Cancer Center; NR = not reached; OS = overall survival.
E U R O P E A N U R O L O G Y 7 2 ( 2 0 1 7 ) 9 6 2 – 9 7 1
966