


 957 1030

Since mutational count is associated with response to
systemic checkpoint inhibitor immunotherapy, we also
examined the association between mutational count in
NMIBC with recurrence after BCG immunotherapy
[18]. We
were unable to identify an association between mutational
count on MSK-IMPACT and tumor recurrence after BCG
(HR = 0.96, 95% CI: 0.83–1.1,
p
= 0.3).
4.
Discussion
Most sequencing efforts in bladder cancer have focused on
MIBC. Yet the majority of bladder cancer patients are
diagnosed with NMIBC, the treatment of which imposes
substantial burden to patients and the global health care
system
[3] .To our knowledge, our study is the largest NGS
effort to focus on NMIBC to date. Our objective was to
identify genetic alterations with potential clinical implica-
tions in addressing the many unmet needs of NMIBC
patients.
One major unmet need is reliable screening and
surveillance biomarkers to replace invasive cystoscopies.
The high prevalence of
TERT
promoter mutations and
chromatin-modifying gene alterations seen in every stage
and grade in our study not only suggests that these events
[(Fig._3)TD$FIG]
–0.5
0.0
0.5
0
1
2
3
–log10
p
value
Cox regression log hazard ratio
for risk of recurrence after BCG
ARID1A
CREBBP
FGFR3
0.0
0.2
0.4
0.6
0.8
1.0
0 12 24 36 48 60 72 84 96 108 120
ARID1A mutation (
n
= 17)
ARID1A wild type (
n
= 45)
Time (mo)
Recurrence free survival after BCG
p
= 0.001
A
B
FAT1
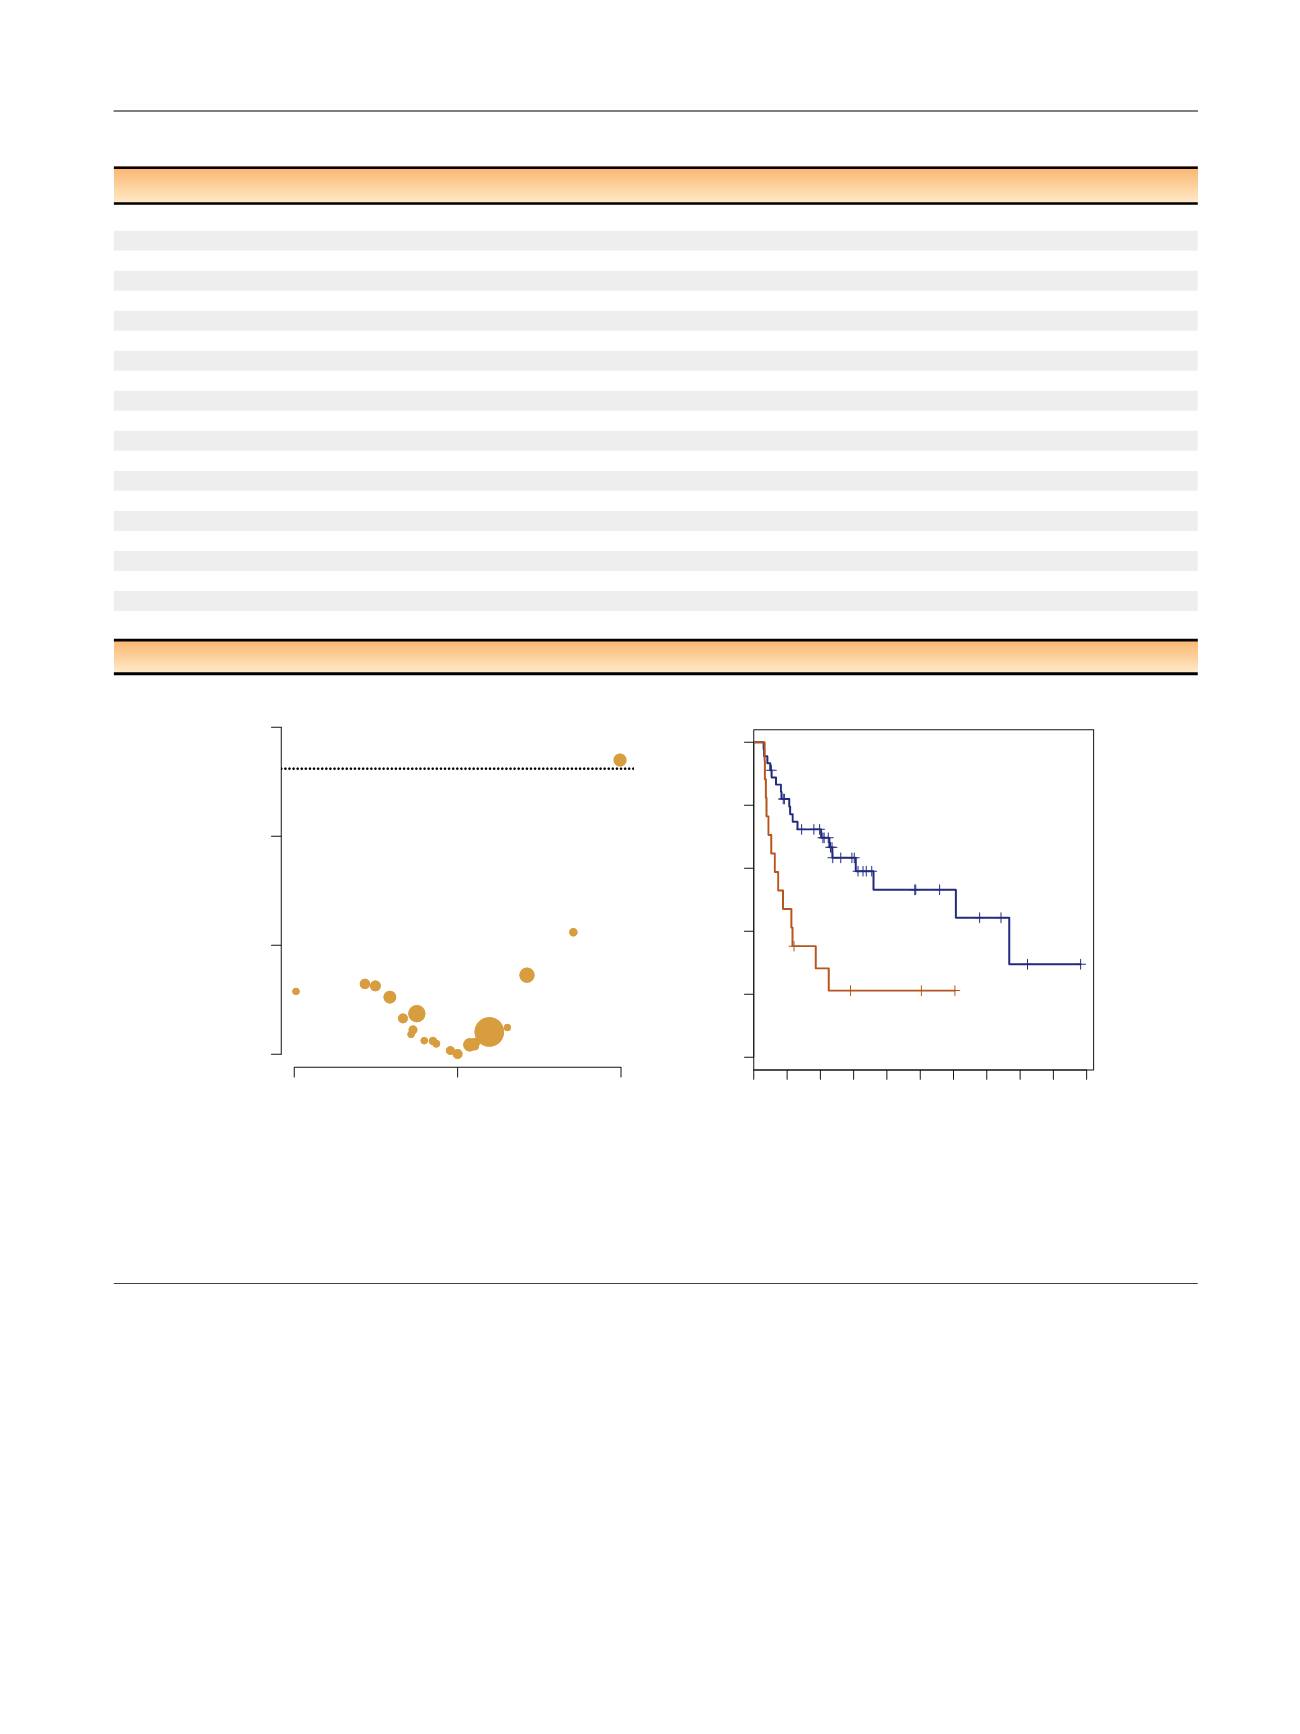
Fig. 3 – (A) Volcano plot of effect size (log odds ratio) by significance (–log10
p
value) for the association between specific genomic alterations and
recurrence after bacillus Calmette-Gue´rin (BCG). Results are from Cox regression analysis (
n
= 62). The horizontal dotted line indicates an adjusted
p
-value <0.05. Bubble size is proportional to the total number of alterations. (B) Kaplan-Meier curve for recurrence after BCG Therapy for tumors with
ARID1A
truncating mutations compared to
ARID1A
wild-type (
n
= 62).
Table 2 – Cox regression between genomic alterations and recurrence after BCG therapy (
n
= 62, 32 events)
Gene
HR
95% CI
p
value
False discovery rate
ARID1A
3.14
(1.51, 6.51)
0.002
0.04
FGFR3
1.63
(0.79, 3.37)
0.188
0.9
KRAS
0.79
(0.18, 3.38)
0.75
0.94
ERBB2
0.56
(0.21, 1.46)
0.236
0.9
PIK3
0.62
(0.26, 1.52)
0.299
0.9
TSC1
0.84
(0.29, 2.43)
0.755
0.94
TP53
1.09
(0.51, 2.32)
0.819
0.94
CDKN2A
0.68
(0.24, 1.94)
0.469
0.94
CDKN1A
0.95
(0.33, 2.73)
0.924
0.97
CCND1
0.72
(0.17, 3.03)
0.656
0.94
STAG2
1.13
(0.46, 2.78)
0.785
0.94
KDM6A
0.75
(0.36, 1.53)
0.424
0.94
EP300
1.13
(0.34, 3.71)
0.847
0.94
CREBBP
2.26
(0.92, 5.55)
0.076
0.8
TERT
1.25
(0.51, 3.11)
0.624
0.94
ERCC2
0.52
(0.18, 1.49)
0.226
0.9
KMT2D
1
(0.38, 2.62)
0.994
0.99
RBM10
1.42
(0.43, 4.68)
0.568
0.94
FAT1
0.32
(0.04, 2.37)
0.265
0.9
FBXW7
0.73
(0.22, 2.39)
0.597
0.94
MGA
0.86
(0.26, 2.84)
0.799
0.94
BCG = bacillus Calmette-Gue´rin; CI = confidence interval; HR = hazard ratio.
E U R O P E A N U R O L O G Y 7 2 ( 2 0 1 7 ) 9 5 2 – 9 5 9
957