


 891 1030

calibration plots, which were internally validated using bootstrapping
with 1000 iterations.
Last, we assessed the performance of novel RMs not only for
discrimination, but also for its clinical usefulness by using decision and
net reduction curves based on 100-times repeated 10-fold cross
validation
[18]. To quantify potential reduction of unnecessary
biopsies, as well as potential overdiagnosis, we calculated true and
false positive rates (TPR and FPR, respectively), and positive and
negative predictive values (PPV and NPV, respectively) at exemplary
probability thresholds.
Table 2 – Multivariate logistic regression model analysis for the prediction of significant PC for biopsy-naı¨ve men and men after previous
biopsy
Parameter
Odds ratio
95% CI
p
value
Multivariate logistic regression model analysis for the prediction of significant PC for biopsy-naı¨ve men
mpMRI PI-RADS score
<
0.001
mpMRI PI-RADS Likert score 2:mpMRI PI-RADS Likert score 1
0.86
0.42–1.19
mpMRI PI-RADS Likert score 3:mpMRI PI-RADS Likert score 1
1.87
1.07–3.29
mpMRI PI-RADS Likert score 4:mpMRI PI-RADS Likert score 1
4.63
2.67–8.05
mpMRI PI-RADS Likert score 5:mpMRI PI-RADS Likert score 1
8.01
4.10–15.69
PSA (interquartile OR, PSA 11 vs PSA 5.5)
2.08
1.65–2.63
<
0.001
Prostate volume (per 10 ml)
0.81
0.75–0.88
<
0.001
Digital rectal examination (
<
cT2 vs cT2)
4.09
2.60–6.43
<
0.001
Age (per 5 yr)
1.09
0.96–1.24
0.17
Multivariate logistic regression model analysis for the prediction of significant PC for men after previous biopsy
mpMRI PI-RADS score
<
0.001
mpMRI PI-RADS Likert score 2:mpMRI PI-RADS Likert score 1
1.35
0.44–4.11
mpMRI PI-RADS Likert score 3:mpMRI PI-RADS Likert score 1
3.31
1.52–7.24
mpMRI PI-RADS Likert score 4:mpMRI PI-RADS Likert score 1
6.31
2.80–14.22
mpMRI PI-RADS Likert score 5:mpMRI PI-RADS Likert score 1
22.06
8.13–59.87
PSA (interquartile OR, PSA 11 vs PSA 5.5)
1.46
1.12–1.92
0.006
Prostate volume (per 10 ml)
0.82
0.74–0.91
<
0.001
Digital rectal examination (
<
cT2 vs cT2)
2.04
1.09–3.82
0.03
Age (per 5 yr)
1.19
0.99–1.43
0.07
CI = confidence interval; mpMRI = multiparametric magnetic resonance imaging; PI-RADS = Prostate Imaging Reporting and Data System; PSA = prostate-
specific antigen; OR = odds ratio; PC = prostate cancer.
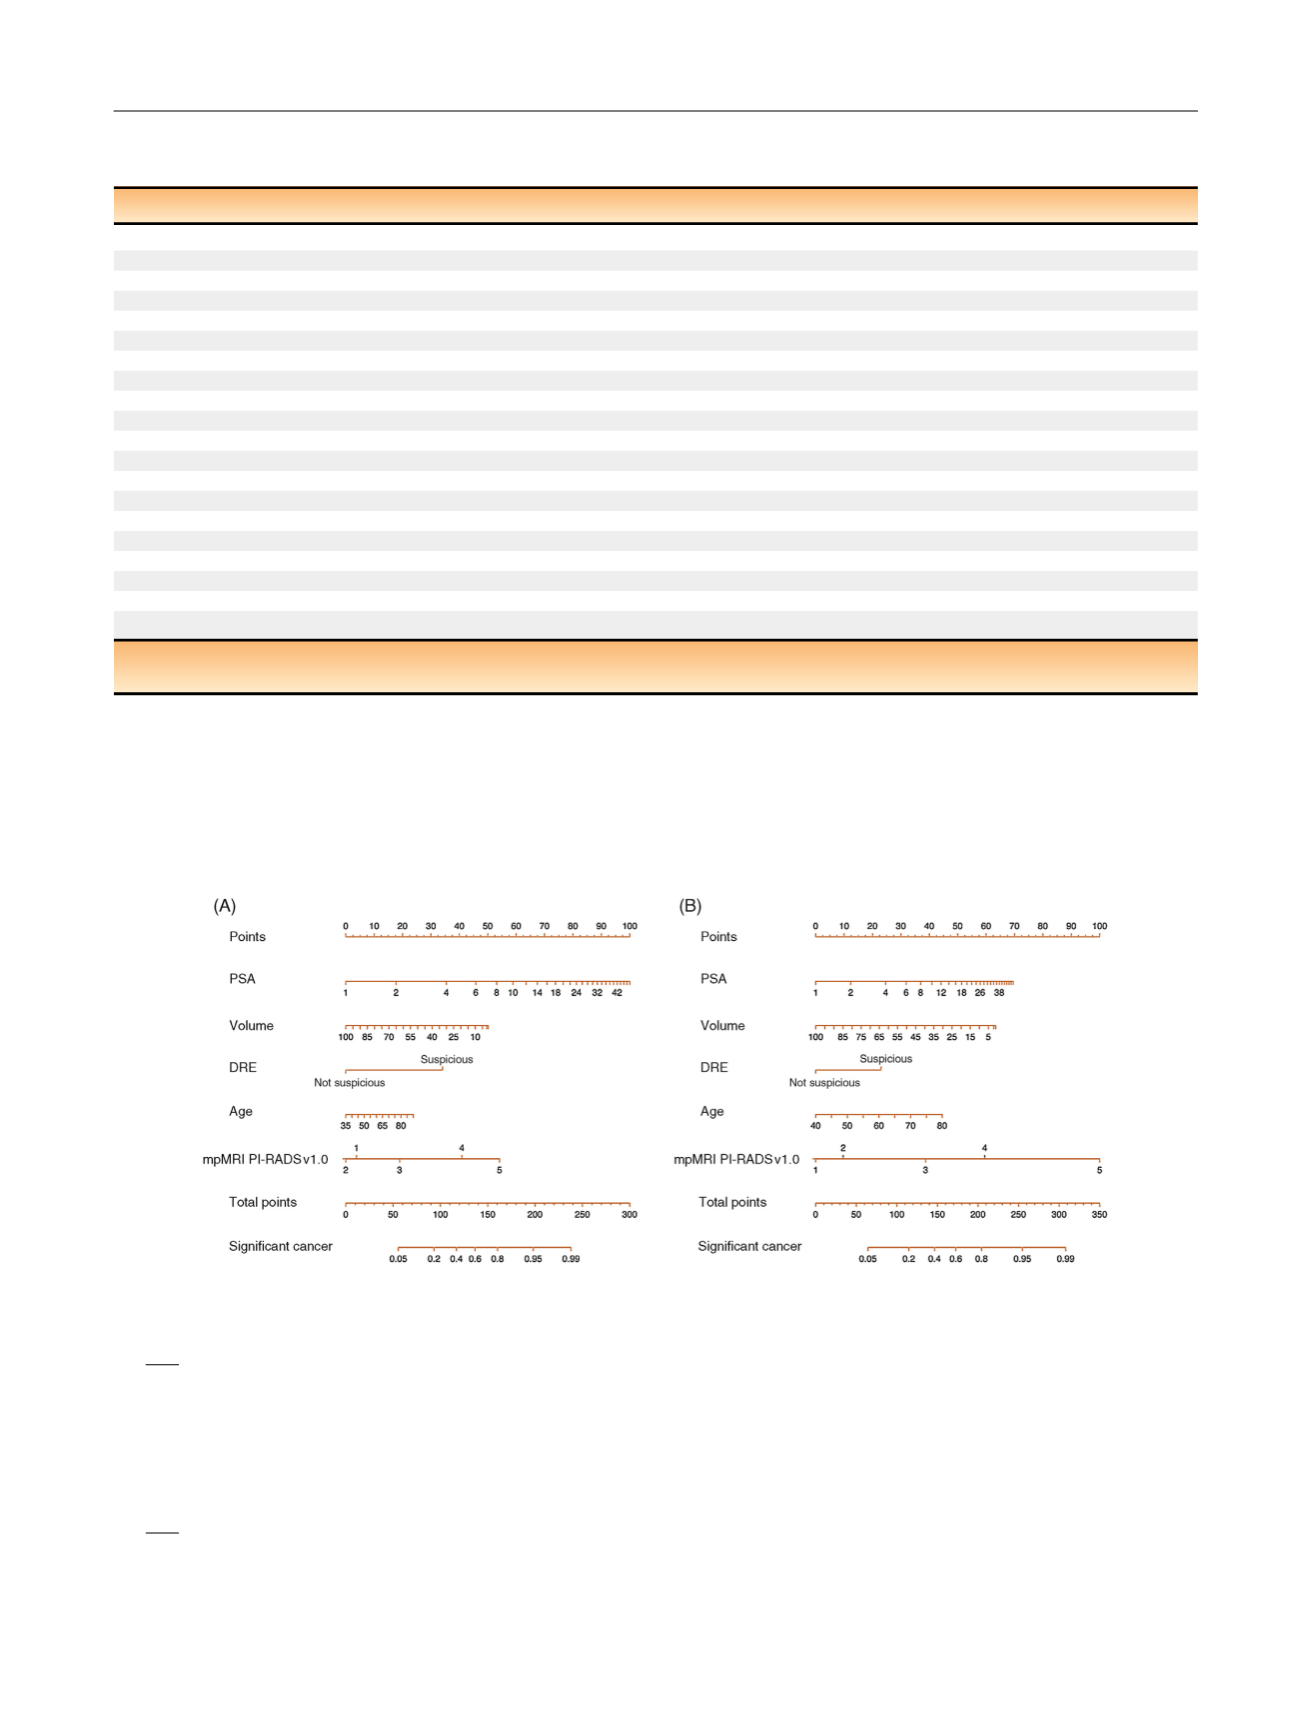
[(Fig._1)TD$FIG]
Fig. 1 – Risk model to predict sPC including mpMRI PI-RADS, PSA, age, prostate volume and DRE for (A) biopsy-naı¨ve men and (B) men after previous
biopsy. The regression equations are as follows. For the risk model for biopsy-naı¨ve men:
log
p
i
1
p
i
¼
2
:
206
þ
1
:
056 log
PSA
i
ð
Þ
0
:
021
volume
i
þ
0
:
018
age
i
þ
1
:
407 I
DRE
i
cT2
ð
Þ
0
:
156 I
PIRADS
i
¼
2
ð
Þ þ
0
:
627 I
PIRADS
i
¼
3
ð
Þ þ
1
:
533 I
PIRADS
i
¼
4
ð
Þ
þ
2
:
081 I
PIRADS
i
¼
5
ð
Þ
where
p
i
is the (conditional) probability of significant PC for patient
i
given values of the covariates,
volume
is the prostate volume per 10 ml, and
age
is the patient’s age per 5 yr. I(
DRE
i
I
cT2) denotes the dummy variable that is 1 if the digital rectal examination value is
I
cT2 (suspicious) and
0 otherwise. I(
PIRADS
i
=
j
) denotes the dummy variable that is 1 if
PIRADS
i
=
j
for
j
= 2,..., 5 (reference category PI-RADS = 1). For the risk model for men
after previous biopsy:
log
p
i
1
p
i
¼
3
:
623
þ
0
:
550log
PSA
i
ð
Þ
0
:
020
volume
i
þ
0
:
034
age
i
þ
0
:
712 I
DRE
i
cT2
ð
Þ þ
0
:
299 I
PIRADS
i
¼
2
ð
Þ þ
1
:
198 I
PIRADS
i
¼
3
ð
Þ þ
1
:
841 I
PIRADS
i
¼
4
ð
Þ
þ
3
:
094 I
PIRADS
i
¼
5
ð
Þ
DRE = digital-rectal examination; mpMRI = multiparametric magnetic resonance imaging; PC = prostate cancer; PI-RADS = Prostate Imaging Reporting
and Data System; PSA = prostate-specific antigen; sPC = significant prostate cancer.
E U R O P E A N U R O L O G Y 7 2 ( 2 0 1 7 ) 8 8 8 – 8 9 6
891