


 E172 1030

Letter to the Editor
Re: Eric A. Klein, Arnon Chait, Jason M. Hafron, et al.
The Single-parameter, Structure-based IsoPSA Assay
Demonstrates Improved Diagnostic Accuracy for
Detection of Any Prostate Cancer and High-grade
Prostate Cancer Compared to a Concentration-based
Assay of Total Prostate-specific Antigen: A Preliminary
Report. Eur Urol 2017;72:942–9
The Most Appropriate IsoPSA Cutoff for Diagnosis of
Prostate Cancer
In their article on determination of IsoPSA cutoff value for
the diagnosis of prostate cancer, Klein et al
[1]reported a
cutoff point with sensitivity (Se) of 90% and specificity (Sp) of
48% to discriminate men with and without prostate cancer.
However, to determine the most appropriate cutoff value
for a test with continuous results such as IsoPSA, we need to
take into account the pretest probability (
P
pr
) of the disease
(prostate cancer) and an estimate of the cost of a false-
negative relative to a false-positive test result (
C
)
[2,3]. We
have shown that maximizing the weighted number needed
to misdiagnose (wNNM) corresponds to the most appro-
priate test cutoff value
[2,4]:
wNNM
¼
1
C P
pr
1 Se
ð
Þ þ
1
P
pr
1 Sp
ð
Þ
To calculate this index, we need to know estimates of
P
pr
and
C
, as well as Se and Sp values corresponding to each
point on the receiver operating characteristic (ROC) curve.
Klein et al
[1]reported that the prevalence of prostate
cancer in their sample was 53%.
If we do not diagnose a patient with prostate cancer
(false-negative result), he returns in a worse condition
needing more extensive treatment. Conversely, designating
a healthy man as having prostate cancer (false-positive
result) would result in unnecessary tests, waste of
resources, time, and money, and psychological trauma to
him and his family members. Let us assume that the costs
associated with a false-negative result are 15 times those
for a false-positive result (
C =
15)
[5]. To determine Se and
Sp corresponding to each point on the ROC curve (Fig. 2A in
[1] ), we scanned the figure using a digitizer (GTCO CalComp,
Scottsdale, AZ, USA).
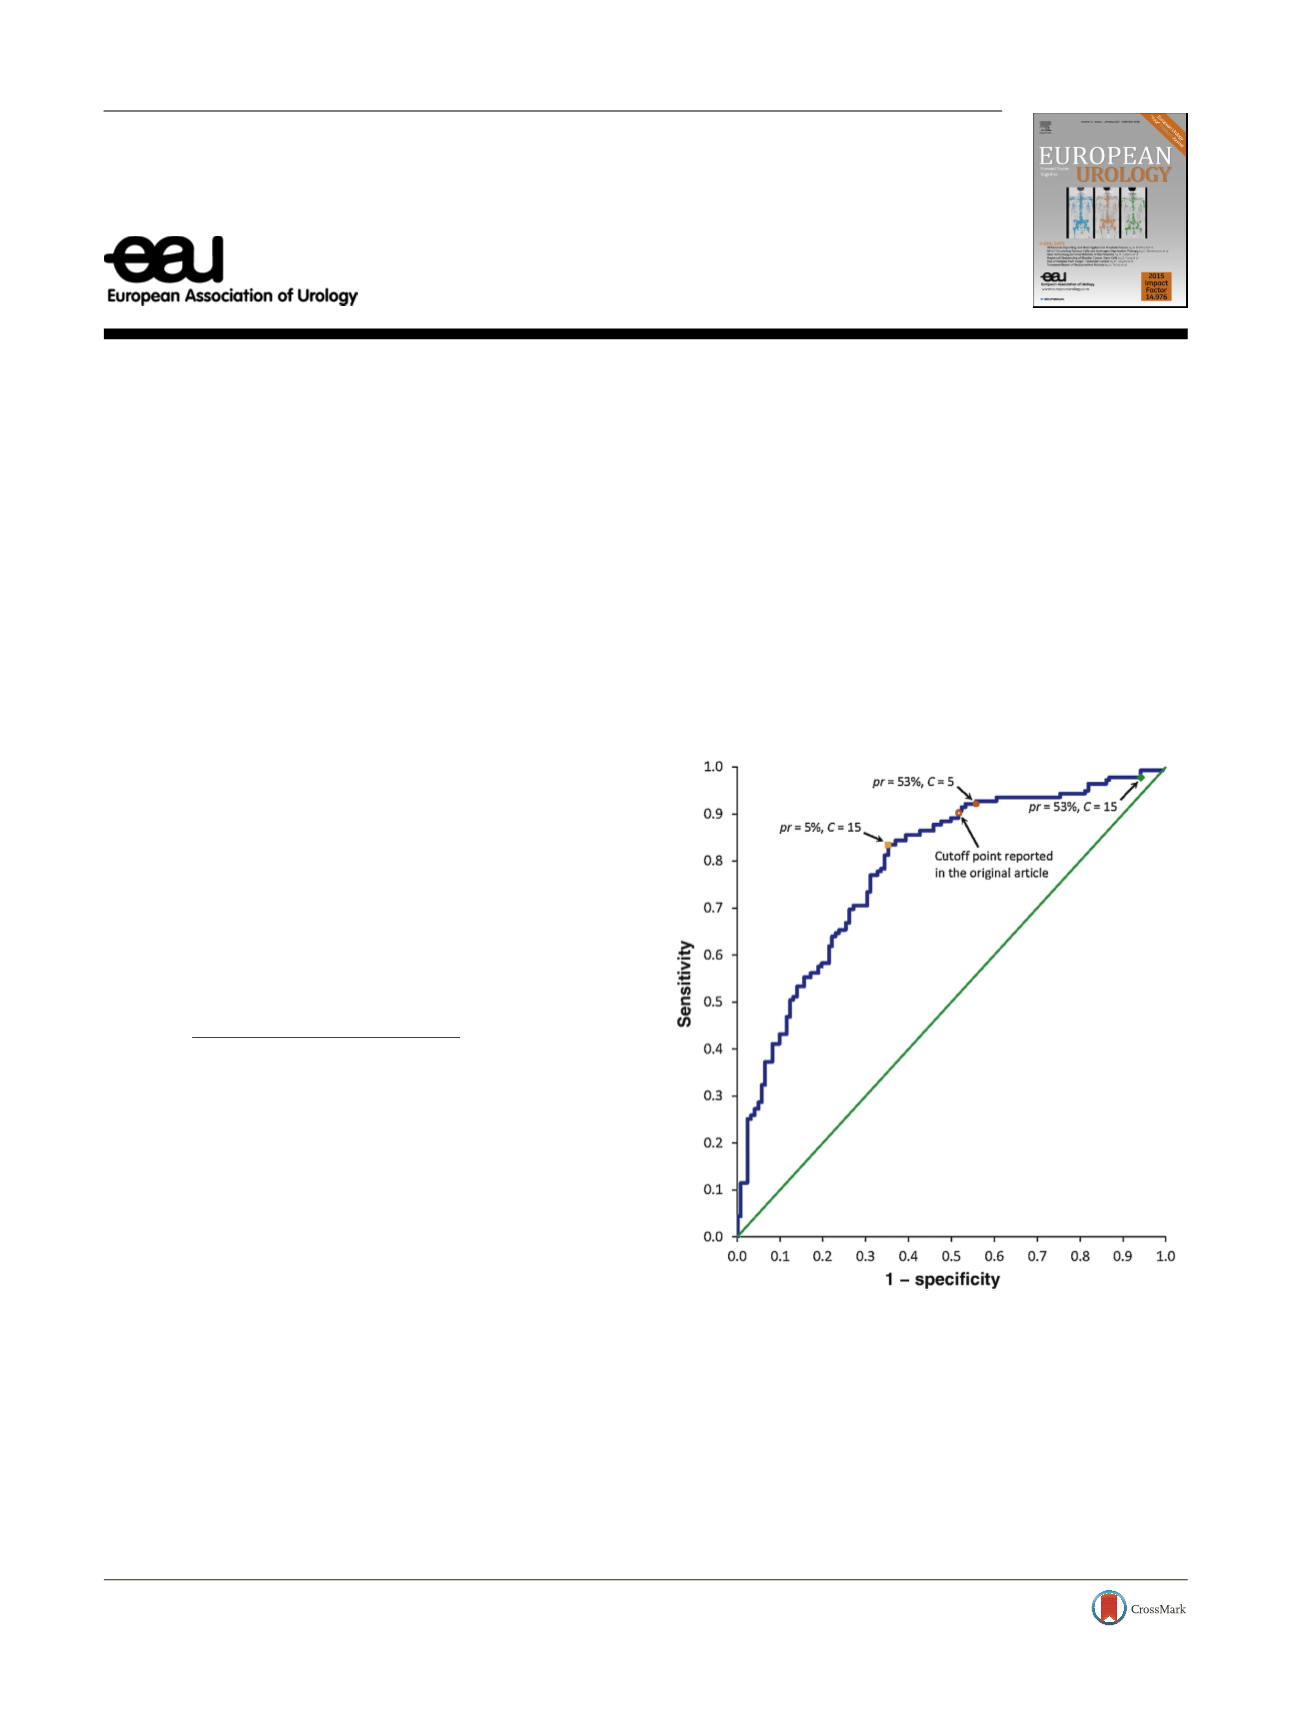
The most appropriate cutoff value (maximum wNNM)
corresponds to a point at Se = 99% and Sp = 6%
( Fig. 1)
[2] .This value, however, changes depending on the
condition under which we want to use it. For example,
assuming prevalence of 5% (instead of 53%), the cutoff value
corresponds to a point at Se = 83% and Sp = 65% (retaining
C
= 15); assuming prevalence of 53%, but
C
= 5 (instead of
15), the most appropriate cutoff value corresponds to a
point at Se = 93% and Sp = 44%
( Fig. 1 ). Having access to the
raw data, the authors can determine the IsoPSA levels
corresponding to each of the aforementioned points. Similar
analyses can be performed to determine the most
E U R O P E A N U R O L O G Y 7 2 ( 2 0 1 7 ) e 1 7 2 – e 1 7 3available at
www.scienced irect.comjournal homepage:
www.europeanurology.com[(Fig._1)TD$FIG]
Fig. 1 – Receiver operating characteristic curve for discriminating men
with and without prostate cancer, regenerated from parts of Figure 2A
in the article by Klein et al
[1]. The open red circle is the point they
reported for discrimination. However, if the data presented in the
article (prevalence of 53%) are used, assuming
C
= 15, the most
appropriate cutoff value corresponds to another point (the green
diamond). Using the same assumptions but
C
= 5 (instead of 15), the
most appropriate cutoff value corresponds to another point (red solid
circle). Assuming a prostate cancer prevalence of 5% (instead of 53%)
and
C
= 15, the point corresponds to the orange solid square. Cutoff
values were calculated following Habibzadeh et al
[2].
DOI of original article:
http://dx.doi.org/10.1016/j.eururo.2017.03.025.
http://dx.doi.org/10.1016/j.eururo.2017.06.0280302-2838/
#
2017 European Association of Urology. Published by Elsevier B.V. All rights reserved.