


 947 1030

platforms most widely used today, including X-ray–based
imaging (eg, mammography) and blood-based expression of
specific proteins (eg, PSA), whose lack of specificity for cancer
is in part due to their lack of direct connection to the
underlying disease processes. In particular, PSA is prostate-
specific but not PCa-specific, leading to significant limitations
in diagnostic accuracy and resulting in an excess of
unnecessary biopsies and overdetection and overtreatment
of nonlethal cancers. More recent PSA-based tests, such as PHI
and 4Kscore, have better specificity for high-grade cancer
[18–20]but measure only a limited number of PSA isoforms
that may not be present in some patients.
In this study we evaluated the clinical performance of a
novel blood-based assay, IsoPSA, which measures structural
changes in PSA that result directly from disordered cellular
processes present in PCa. We demonstrate that IsoPSA has
better diagnostic accuracy compared to standard PSA for
detection of PCa and high-grade PCa in a cohort of men
undergoing biopsy for indications typical in contemporary
urologic practice. According to a variety of analytical tools
(ROC curves, logistic regression, and DCA), IsoPSA out-
performed a standard concentration-based PSA assay in this
study. The results show that if adopted clinically, IsoPSA
could significantly reduce the rate of unnecessary biopsies
by almost 50% while preserving both PPV and NPV for
detection of cancer versus no cancer and of high-grade PCa
versus low-grade PCa/benign histology.
Use of the IsoPSA assay has many strengths compared to
currently available PSA assays. First, by measuring structural
changes in PSA that arise specifically in cancer cells, it is less
affected by conditions such as benign prostatic hyperplasia,
inflammation, and age that reduce the specificity of standard
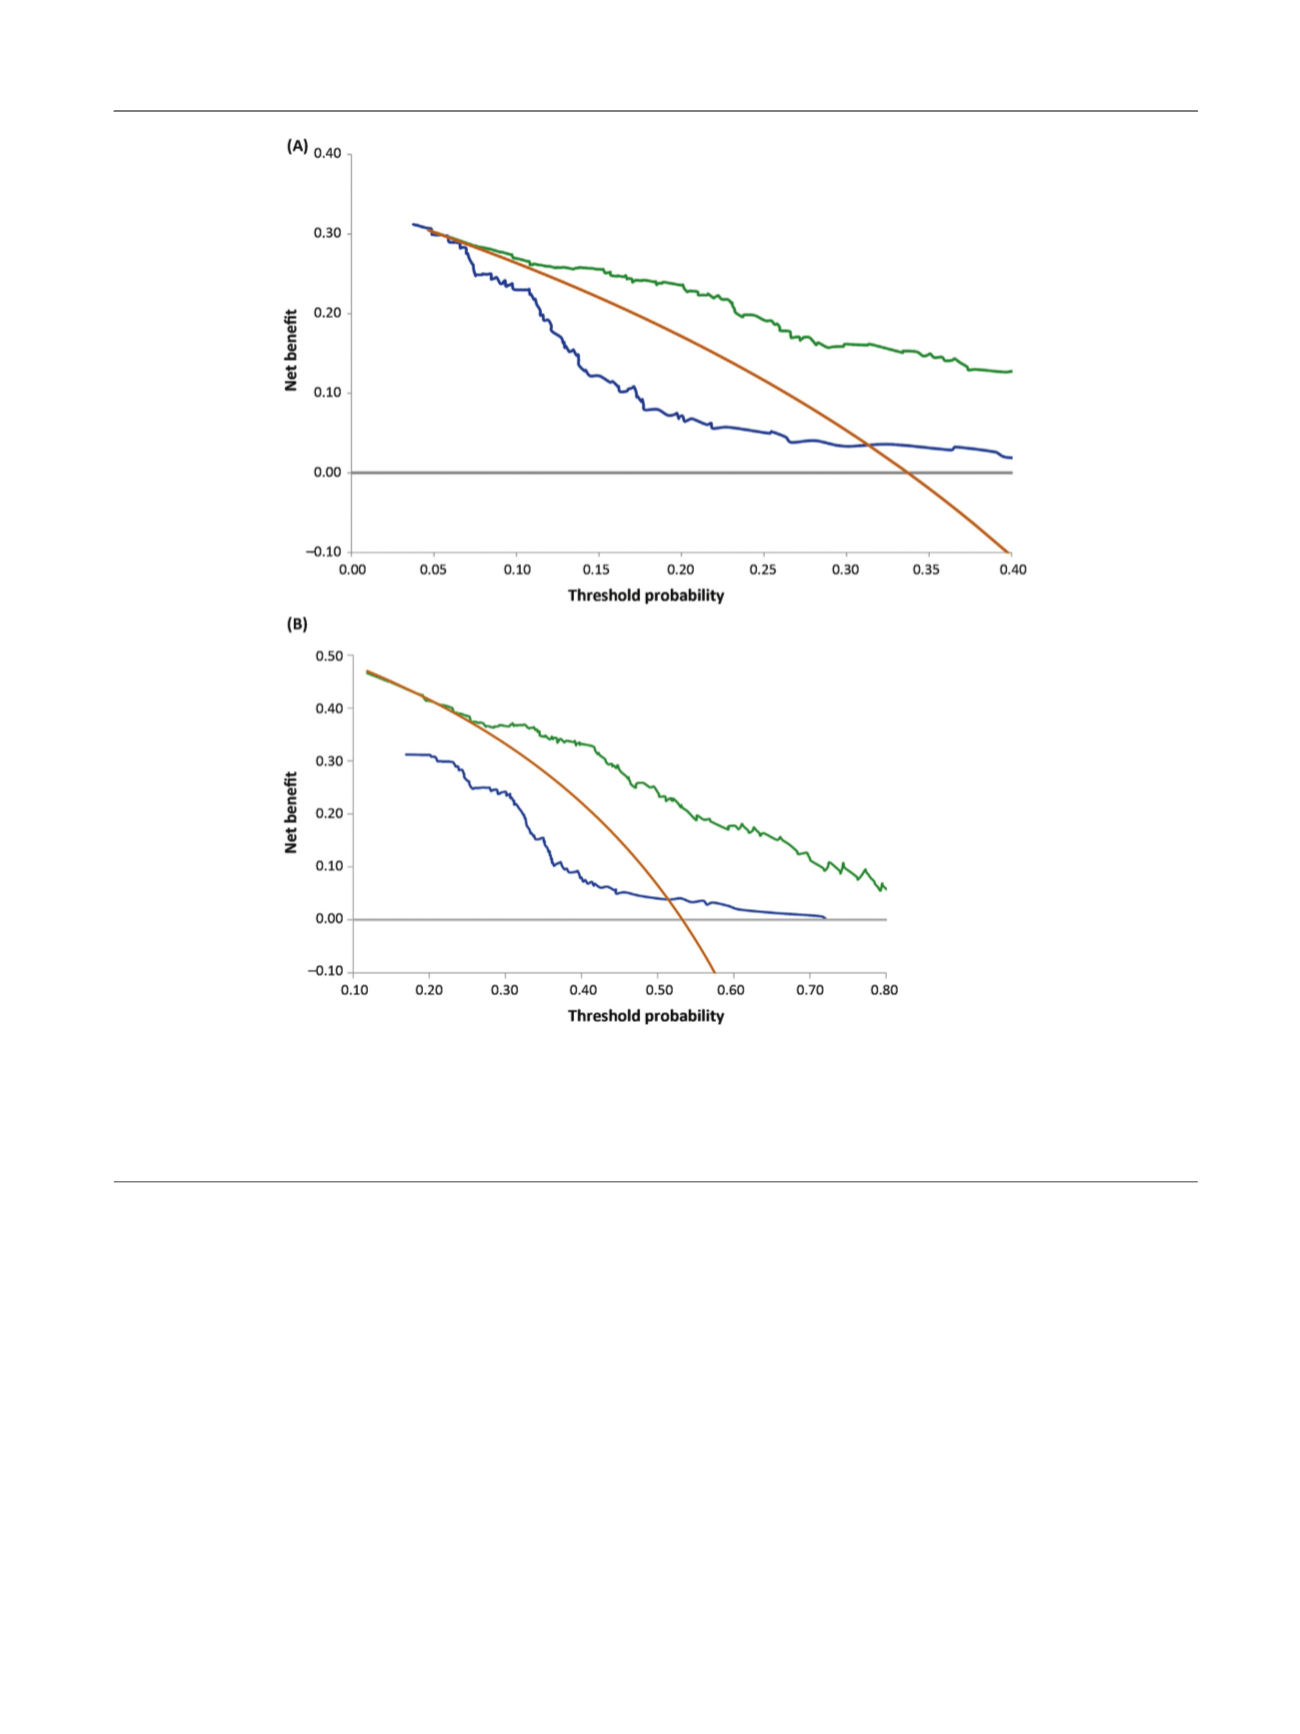
[(Fig._3)TD$FIG]
Fig. 3 – (A) Decision curve analysis (DCA) comparing IsoPSA (green line) to the modified Prostate Cancer Prevention Trial Risk Calculator (PCPTRC)
2.0 (blue line) for high-grade prostate cancer (PCa) versus low-grade PCa/benign histology, and two extreme protocols: biopsy no patients (gray line)
and biopsy all patients (yellow line) for the study cohort. In the DCA, at any given threshold probability, the model with the best clinical outcome is
associated with the highest net benefit. (B) DCA comparing IsoPSA (green line) to the modified PCPTRC 2.0 (blue line) for all cancer versus no cancer,
and two extreme protocols: biopsy no patients (gray line) and biopsy all patients (yellow line) for the study cohort. In the DCA, at any given threshold
probability, the model with the best clinical outcome is associated with the highest net benefit.
E U R O P E A N U R O L O G Y 7 2 ( 2 0 1 7 ) 9 4 2 – 9 4 9
947