


 946 1030

only those with high grade PCa, KR-HG = 17% results in a
45% reduction in unneeded biopsies (from 173 to 95). A
summary of the number of biopsies avoided and delayed
(false negatives) versus risk probability cutoff values is
provided in
Table 4.
4.
Discussion
In selecting a diagnostic test, especially for cancer, it is
paramount to focus on its inherent ability to reflect underlying
disease-related biology. Specificity is the weakness of the test
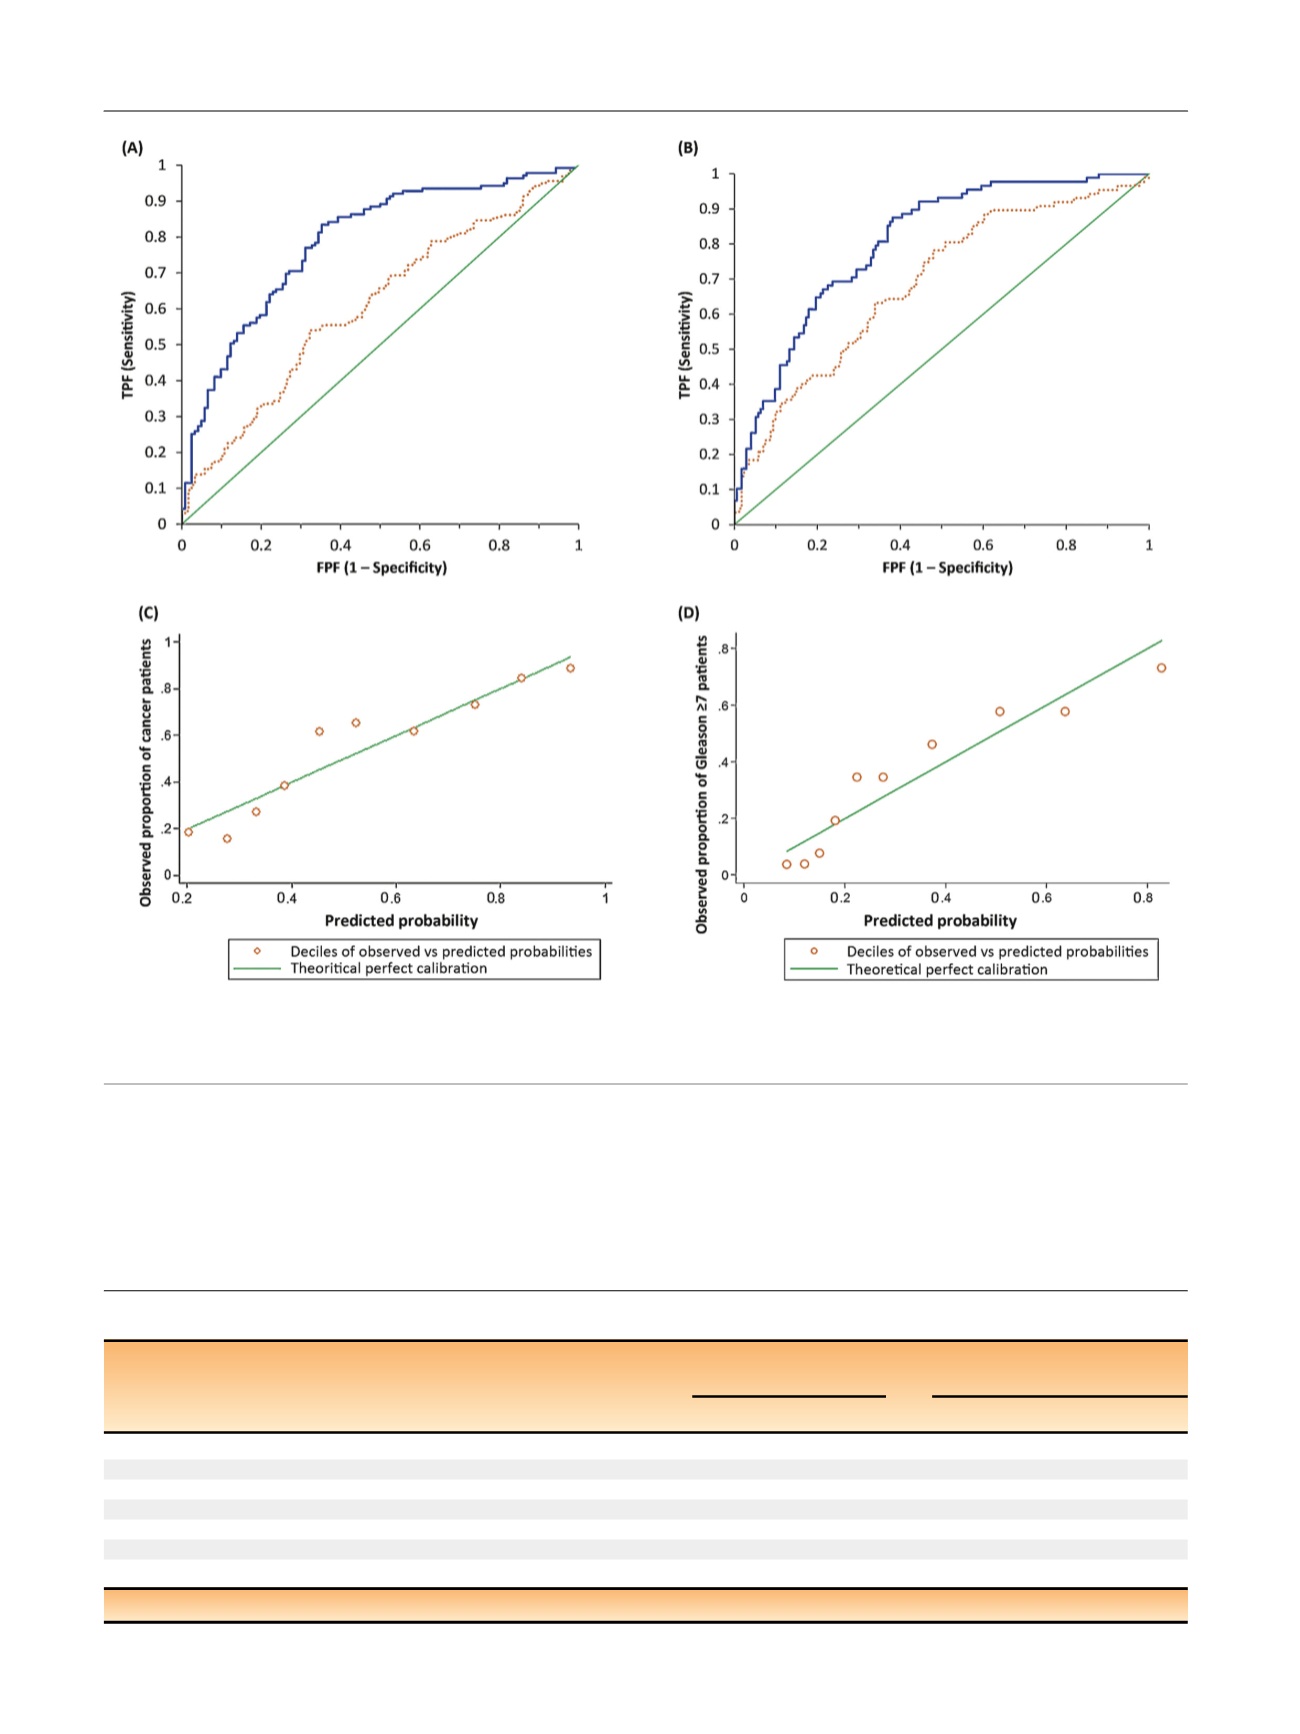
[(Fig._2)TD$FIG]
Fig. 2 – Receiver operating characteristic (ROC) analysis and calibration plots for the models. ROC for (A) cancer versus no cancer and (B) high-grade
cancer versus low-grade cancer/benign histology. Calibration plot for (C) cancer versus no cancer and (D) high-grade cancer versus low-grade cancer/
benign histology. Solid line = IsoPSA; dotted line = standard prostate-specific antigen; TPF = true positive fraction; FPF = false positive fraction.
Table 4 – Biopsies avoided and delayed for high-grade cancer versus low-grade cancer/benign history according to IsoPSA cutoff value
IsoPSA
KR-HG cutoff
Biopsies
performed (
n
)
Reduction
in FPs,
n
(%)
Biopsies
avoided,
n
(%)
GS 7 cancer,
n
(%)
Gleason score for delayed Dx of
GS 7 cancer,
n
(%)
Detected Dx delayed
3 + 4
4 + 3
4 + 4*
0%
261
0 (0)
0 (0)
88 (34)
0 (0)
0 (0)
0 (0)
0 (0)
10%
238
23 (13)
24 (9.2)
87 (33)
1 (0.4)
0 (0)
0 (0)
1 (0.4)
15%
197
65 (38)
67 (26)
86 (33)
2 (0.8)
1 (0.4)
0 (0)
1 (0.4)
17%
183
78 (45)
84 (32)
83 (32)
5 (1.9)
2 (0.8)
2 (0.8)
1 (0.4)
20%
166
96 (55)
103 (39)
81 (31)
7 (2.7)
4 (1.5)
2 (0.8)
1 (0.4)
22%
157
105 (61)
116 (44)
77 (30)
11 (4.2)
6 (2.3)
3 (1.1)
2 (0.8)
25%
148
113 (65)
131 (50)
70 (27)
17 (6.5)
10 (3.8)
4 (1.5)
3 (1.1)
KR-HG = IsoPSA
K
result for high-grade cancer versus benign/low-grade cancer; GS Gleason score; FPs = false positives; Dx = diagnosis.
E U R O P E A N U R O L O G Y 7 2 ( 2 0 1 7 ) 9 4 2 – 9 4 9
946