


 945 1030

Trial Risk Calculator (PCPTRC) 2.0 risk calculator
[17], providing risk
estimates for low-grade versus high-grade cancer with PSA, age, DRE,
race, and prior biopsy as parameters. Performance parameters including
specificity, sensitivity, negative predictive value (NPV), and positive
predictive value (PPV) were examined, and their clinical consequences
for each of the two indications were recorded in terms of biopsies
avoided as defined according to selected cutoff values. Statistical
analysis was conducted using either Analyse-It for Microsoft Excel
v.4.65.2 (Analyse-it Software, Leeds, UK) or Stata/MP 13.1 for Windows
(StataCorp, College Station, TX, USA).
3.
Results
The overall prevalence of PCa in the entire cohort was 53.3%
(139/261), while the prevalence of high-grade PCa was 33.7%
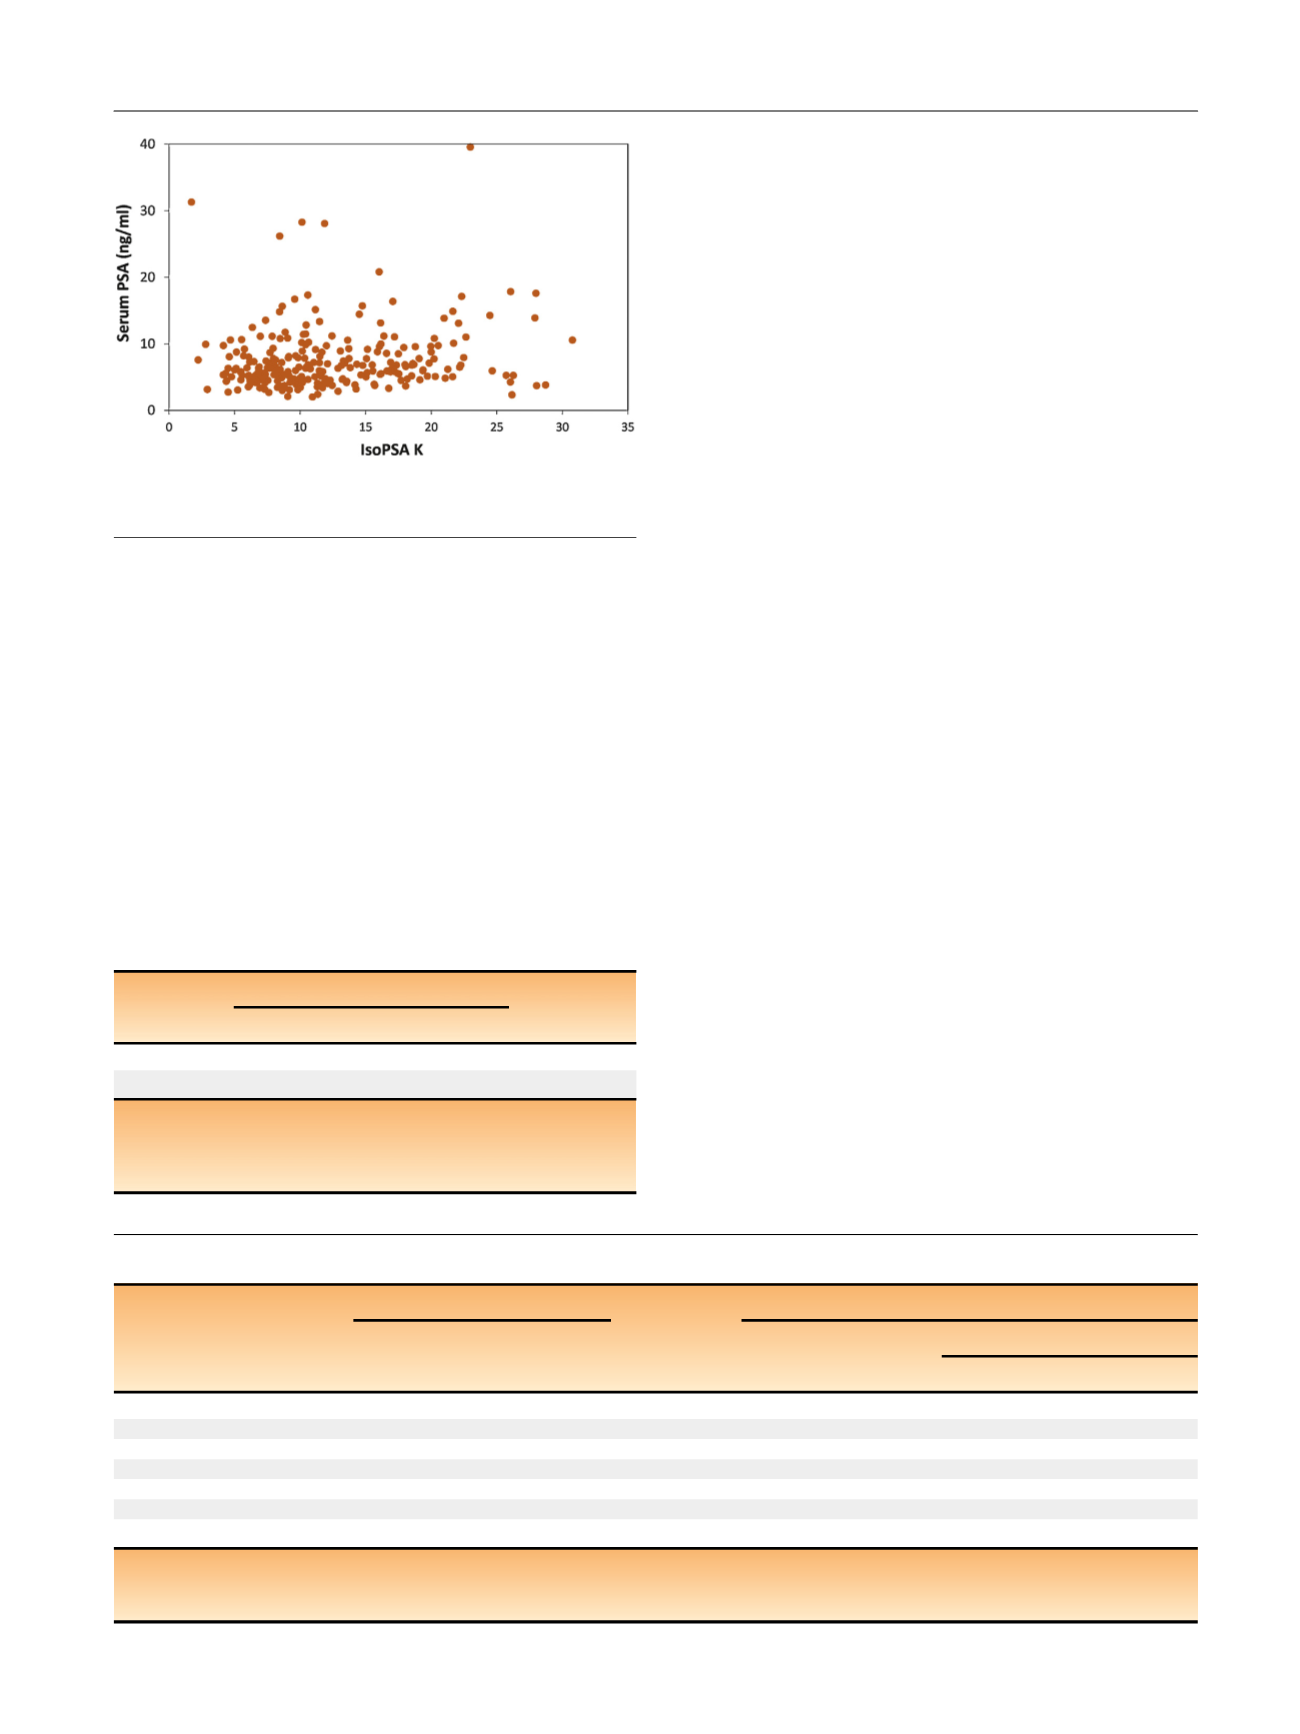
(88/261). As expected, there was no significant correlation
between IsoPSA
K
and serum PSA levels
( Fig. 1 ;Pearson
correlation coefficient 0.2). As measured by ROC, IsoPSA
outperformed standard PSA for both study endpoints
( Table 2and
Fig. 2). For the cancer versus no cancer endpoint, the AUC
was 0.79 (95% CI 0.73–0.84) for IsoPSA versus 0.61 (95% CI
0.54–0.67) for total PSA (
p
<
0.001). For high-grade cancer
versus low-grade cancer/benign histology, the AUC was 0.81
(95% CI 0.74–0.86) for IsoPSA versus 0.69 (95% CI 0.61–0.75)
for total PSA (
p
<
0.005). Calibration curves for both end-
points demonstrated very good correspondence between
predicted and observed results, with a Hosmer-Lemeshow
statistic of 8.21 (
p
= 0.41,
>
0.05) for cancer versus no cancer
and 9.86 (
p
= 0.28,
>
0.05) for high-grade cancer versus low-
grade cancer/benign histology
( Fig. 2).
Table 3shows the
sensitivity, specificity, PPV, and NPV for IsoPSA versus total
PSA at selected cutoff values for risk probability for the
endpoints cancer versus no cancer (KR-CNC) and high-grade
PCa versus low-grade PCa/benign histology (KR-HG). Recog-
nizing that the decision to perform or forgo a biopsy depends
on clinical suspicion and both patient and physician risk
tolerance,
Table 3suggests some clinically relevant scenarios
illustrating the superior predictive power of IsoPSA. For
example, as an exclusion test for separating PCa from benign
disease, a risk probability cutoff value of KR-CNC = 35% for
IsoPSA provides a good balance of high sensitivity (90%) and
specificity (48%), whereas at similar sensitivity (87%)
standard PSA (at 4 ng/ml) has significantly inferior specificity
(15%). As an exclusion test to identify patients at high risk of
high-grade PCa, a KR-HG cutoff of 17% yields NPV of 96%,
while KR-HG of 70% yields PPV of 76%.
DCA also demonstrated superior performance for IsoPSA
compared to the modified PCPTRC 2.0 risk calculator. For
expression as net benefit,
Fig. 3illustrates DCA results for a
relevant risk probability range for the two study endpoints.
If the goal is to identify all patients with cancer of any grade,
KR-CNC = 35% results in a 48% reduction in unneeded
biopsies (from 122 to 63). For the objective of identifying
Table 3 – Performance metrics versus PSA at selected cutoff values for risk probability
Cancer vs no cancer
High-grade PCa vs low-grade PCa/BH
Total PSA
KR-CNC
Total PSA
IsoPSA KR-HG
Low RP
High RP
Prevalence (%)
53
34
Cutoff
4 ng/ml
35%
4 ng/ml
17%
70%
Sensitivity (%)
87
90
93
96
25
Specificity (%)
15
48
17
43
96
NPV (%)
50
81
83
95
72
PPV (%)
54
66
36
46
76
AUC
0.61
0.79
0.69
0.81
0.81
PSA = prostate-specific antigen; PCa = prostate cancer; BH = benign histology; KR-CNC = IsoPSA
K
result for cancer versus no cancer; KR-HG = IsoPSA
K
result for
high-grade cancer (Gleason 7) versus benign/low-grade cancer (Gleason 6); RP = risk probability; NPV = negative predictive value; PPV = positive predictive
value; AUC = area under the receiver operating characteristic curve.
[(Fig._1)TD$FIG]
Fig. 1 – Serum prostate-specific antigen (PSA) concentration versus
IsoPSA
K
value for all patients.
Table 2 – Area under the ROC curve for IsoPSA versus total PSA for
high-grade cancer versus low-grade cancer/benign histology and
for cancer versus no cancer
Model
Area under the ROC curve (95% CI)
p
valu
e aIsoPSA K
Total PSA
KR-HG
0.81 (0.74–0.86)
0.69 (0.61–0.75)
0.005
KR-CNC
0.79 (0.73–0.84)
0.61 (0.54–0.67)
<
0.001
KR-CNC = IsoPSA
K
result for cancer versus no cancer; KR-HG = IsoPSA
K
result for high-grade cancer (Gleason 7) versus benign/low-grade cancer;
PSA = prostate-specific antigen; ROC = receiver operating characteristic.
a
Delong and Delong test.
E U R O P E A N U R O L O G Y 7 2 ( 2 0 1 7 ) 9 4 2 – 9 4 9
945