


 1029 1030

and was DCE-positive, with increased uptake and washout
of contrast agent, and MRSI-positive, with elevated choline
and reduced citrate on
1
H MRSI. The overall Prostate
Imaging-Reporting and Data System v.2 score was 5.
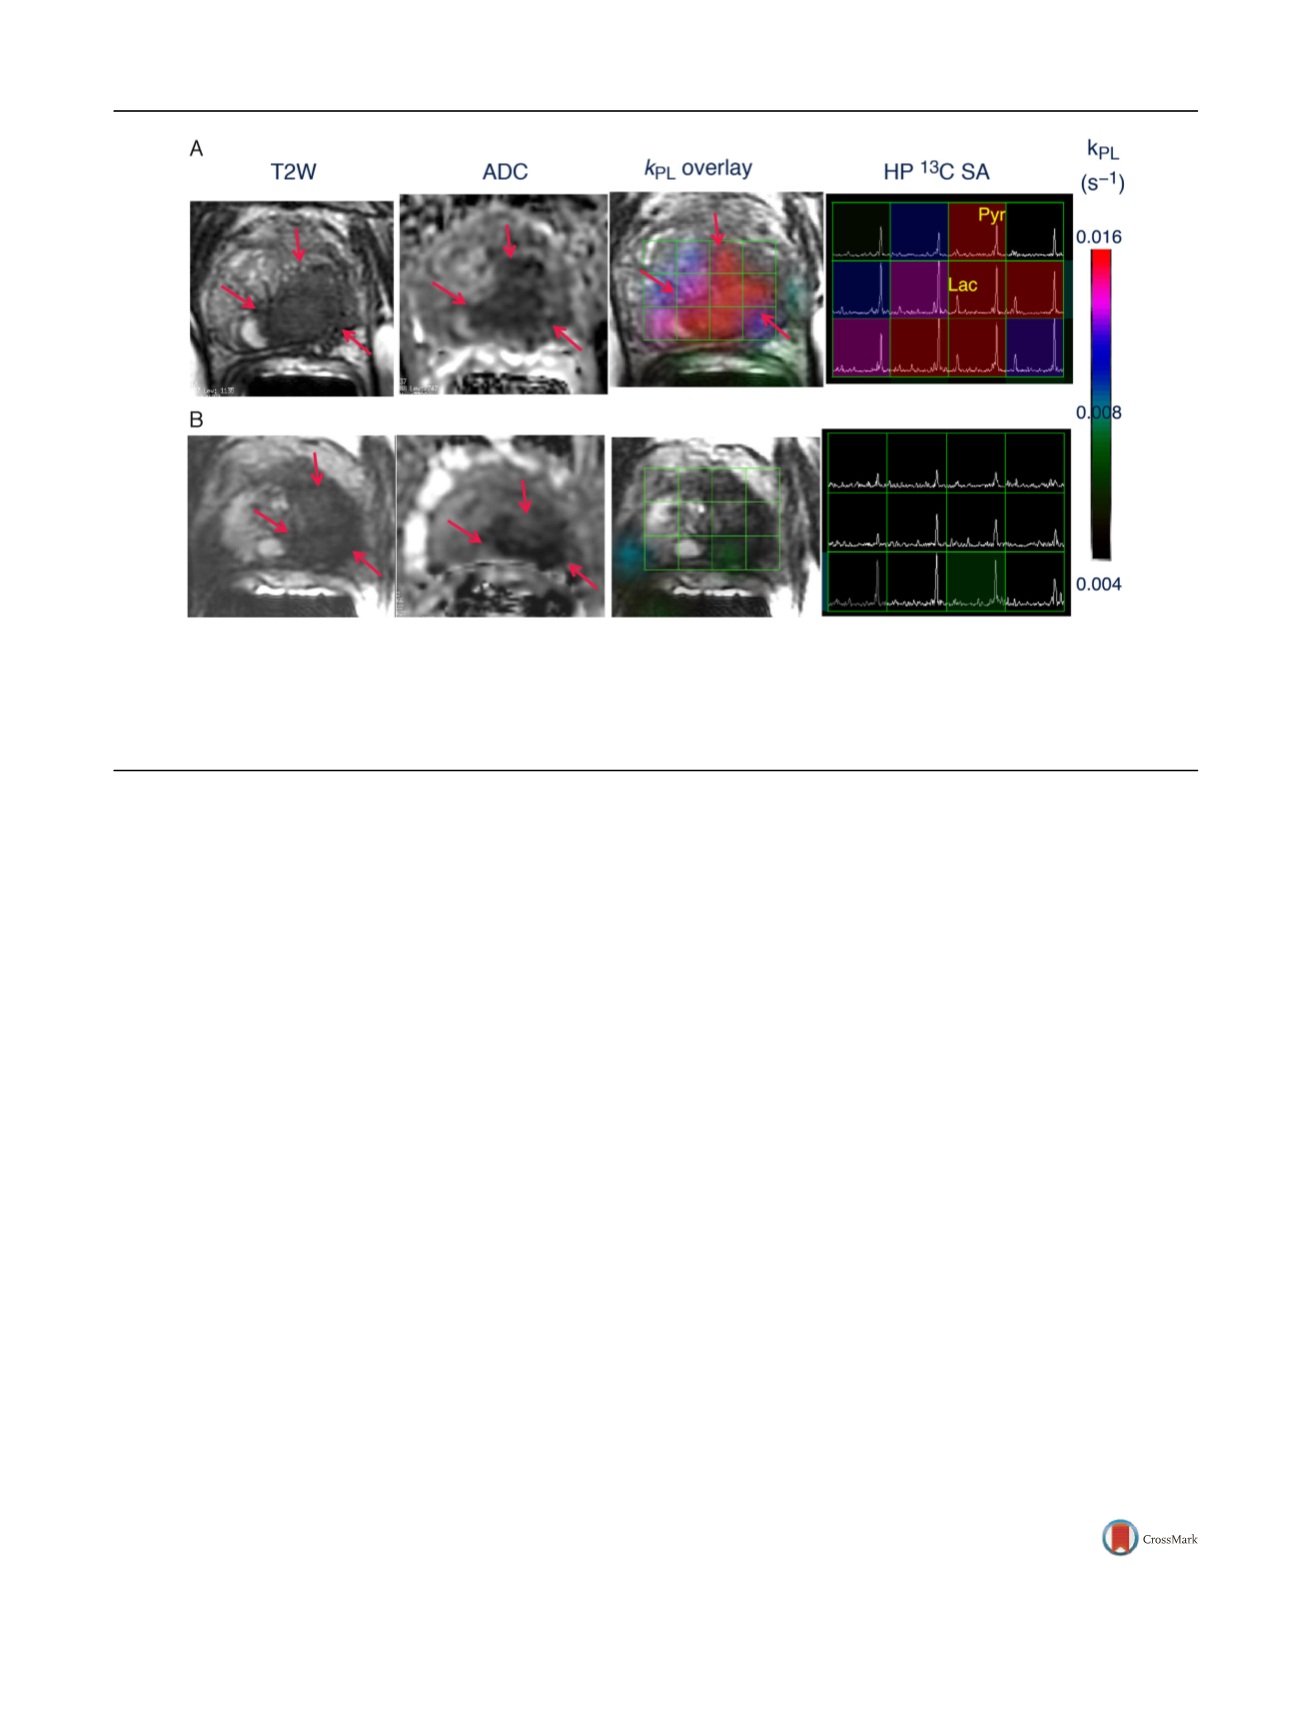
Figure 1A shows the HP
13
C spectral array for the baseline
scan, with markedly elevated lactate peaks within tumor-
containing voxels. A color scale map of dynamic pyruvate-
to-lactate metabolic flux (
k
PL
) values likewise shows
markedly elevated flux levels in the tumor compared to
adjacent normal tissue in the baseline HP [
13
C]-pyruvate
MRI.
At 6 wk after initiation of ADT, repeat imaging
demonstrated nearly complete abrogation of elevated HP
lactate peaks on HP
13
C MRI
( Fig. 1B) and associated near
complete diminution of intratumoral
k
PL
values on dynamic
imaging (
k
PL
max 0.025 s
1
at baseline and 0.007 s
1
on
follow-up). Notably, there was negligible change in size of
tumor on T2-weighted MRI and only a modest change on
ADC imaging, supporting the ability of HP
13
C MRI to detect
early metabolic responses before such a response can be
ascertained using standard radiographic criteria. Concor-
dant with these findings, the patient subsequently achieved
a marked clinical response, with an undetectable serum PSA
nadir at 6 mo after ADT initiation.
This first patient example illustrates the potential of HP
[
13
C]-pyruvate imaging as a metabolic biomarker of
response. Further clinical studies investigating the associa-
tion between metabolic changes on HP
13
C MRI and
response and resistance to treatment are ongoing.
Conflicts of interest:
The authors have nothing to disclose.
Acknowledgments:
This work was supported by NIH
[2_TD$DIFF]
grants
[3_TD$DIFF]
R01EB017449,
[4_TD$DIFF]
P41EB013598,
[5_TD$DIFF]
and
[6_TD$DIFF]
R01CA166655.
[7_TD$DIFF]
We
[8_TD$DIFF]
would
[9_TD$DIFF]
like
[10_TD$DIFF]
to
[11_TD$DIFF]
acknowledge
[12_TD$DIFF]
the
[13_TD$DIFF]
following
[14_TD$DIFF]
for
[15_TD$DIFF]
their
[16_TD$DIFF]
contribution:
[17_TD$DIFF]
Robert
[18_TD$DIFF]
A.
[19_TD$DIFF]
Bok,
[20_TD$DIFF]
Peder
[21_TD$DIFF]
E.
Z.
[22_TD$DIFF]
Larson,
[23_TD$DIFF]
Jeremy
[24_TD$DIFF]
W.
[25_TD$DIFF]
Gordon,
[26_TD$DIFF]
Hsin-Yu
[27_TD$DIFF]
Chen,
[28_TD$DIFF]
Marcus Ferrone,
[29_TD$DIFF]
James B.
Slater,
[21_TD$DIFF]
Mark
[30_TD$DIFF]
van
[31_TD$DIFF]
Criekinge,
[32_TD$DIFF]
Lucas Carvajal,
[33_TD$DIFF]
Sarah J. Nelson,
[21_TD$DIFF]
Eric
[34_TD$DIFF]
J.
[23_TD$DIFF]
Small,
[19_TD$DIFF]
Matt
[35_TD$DIFF]
Cooperberg, Pamela N. Munster, and Albert Chang.
References
[1]
Chen AP, Kurhanewicz J, Bok R, et al. Feasibility of using hyperpo- larized [1- 13[1_TD$DIFF]
C]lactate as a substrate for in vivo metabolic 13 C MRSI studies. Magnetic Resonance Imaging 2008;26:721 – 6.
[2]
Kurhanewicz J, Vigneron DB, Brindle K, et al. Analysis of cancer metabolism by imaging hyperpolarized nuclei: prospects for trans- lation to clinical research. Neoplasia 2011;13:81 – 97.[3]
Ardenkjaer-Larsen JH, Fridlund B, Gram A, et al. Increase in signal- to-noise ratio of 10,000 times in liquid-state NMR. Proc Natl Acad Sci U S A 2003;100:10158 – 63.
[4]
Nelson SJ, Kurhanewicz J, Vigneron DB, et al. Metabolic imaging of patients with prostate cancer using hyperpolarized [1- 13 C]pyru- vate. Sci Transl Med 2013;14:198ra108.University of California San Francisco, San Francisco, CA, USA
*Corresponding author. University of California San Francisco,
1600 Divisadero Street, San Francisco, CA 94131, USA.
Tel. +1 415 3539278; Fax: +1 415 3537779.
E-mail address:
rahul.aggarwal@ucsf.edu(R. Aggarwal).
July 19, 2017
http://dx.doi.org/10.1016/j.eururo.2017.07.022[(Fig._1)TD$FIG]
Fig. 1
–
Representative axial T2-weighted (T2W) anatomic image and corresponding water apparent diffusion coefficient (ADC) image and T2W image
with an overlaid pyruvate-to-lactate metabolic flux (
k
PL
) image and corresponding hyperpolarized (HP)
13
C spectral array (SA) for a 52-yr-old prostate
cancer patient with extensive high-grade prostate cancer (A) before therapy and (B) 6 wk after initiation of androgen ablation and chemotherapy.
Before treatment, the region of prostate cancer can be clearly seen (red arrows) as a reduction in signal on the T2W and ADC images, and increased HP
lactate and associated
k
PL
flux on HP
13
C MRI. After initiation of androgen deprivation therapy there was a significant reduction in reduction in HP
lactate and
k
PL
to normal levels, with only a modest treatment effect on prostate volume and ADC.
E U R O P E A N U R O L O GY 7 2 ( 2 0 17 ) 10 2 7
–
10 2 9
1029