


 977 1030

Cell Renal Cell Carcinoma [ESPN] and Everolimus Versus
Sunitinib for Patients with Metastatic Non-clear Cell Renal
Cell Carcinoma [ASPEN])
[12,13], and one RCT recruiting
RKC and ccRCC patients comparing the same drugs but
reporting the results for each subgroup separately (RE-
CORD-3) provided some of the strongest data to date
[14]. The median PFS in rare RCC patients for sunitinib and
everolimus groups was 6.1 versus 4.1 mo for ESPN,
8.3 versus 5.6 mo for ASPEN, and 7.2 versus 5.1 mo for
RECORD-3. The French phase II SUPAP (Sunitinib as First-
line Therapy in Treating Patients with Locally Advanced
Metastatic Papillary Renal Cell Cancer) trial also demon-
strated sunitinib activity in pRCC patients with a median
PFS of 6.6 mo in 15 type 1 and 5.5 mo in 46 type 2 pRCC
patients
[15]. The EAU RCC Guideline Panel recommends
sunitinib over everolimus and temsirolimus for metastatic
RKCs in first-line treatment, based on a systemic review
[4]. As sunitinib is only modestly effective, and there is a
lack of evidence for the use of other agents routinely used in
ccRCCs such as pazopanib, axitinib, cabozantinib, and
nivolumab, patients with RKCs should be referred as early
as possible (eg, upon confirmation of pathology) to clinical
trials when available.
3.3.
New insights from The Cancer Genomic Atlas and genomic
analysis
Research identifying druggable pathways involved in
ccRCCs assists in the development of therapies based on
genetic and molecular tumor characteristics
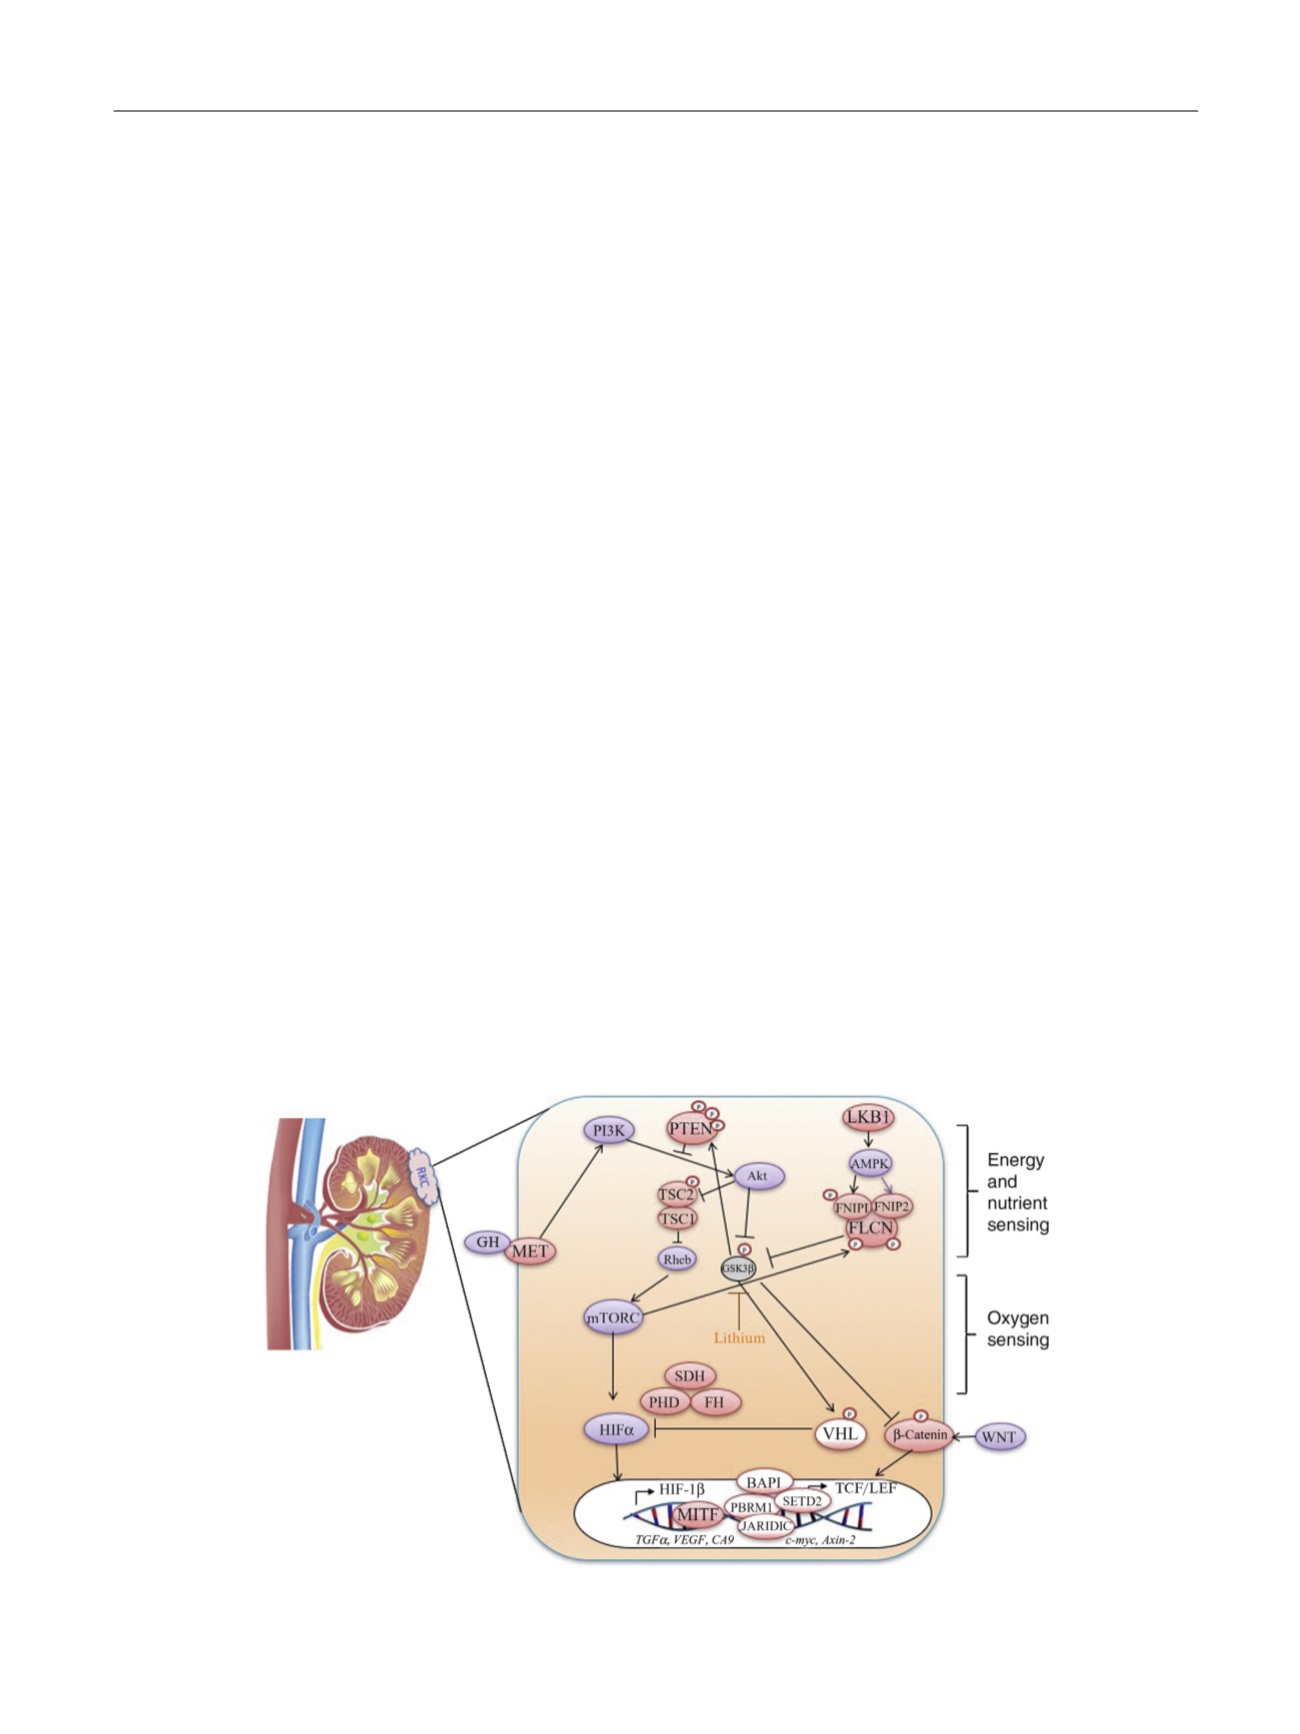
[16] ( Fig. 1).
Genomic analysis of somatic mutations in RKCs revealed
additional genes involved in pRCC and chRCC subtypes as
possible therapeutic targets, including gene sets that could
be used to stratify patients in clinical trials
[17,18]. A pan-
RCC comprehensive molecular analysis using five genomic
platforms was performed on the three TCGA (The Cancer
Genomic Atlas) datasets (
n
= 894 primary RCCs). Nine
distinct subtypes were identified as common with many
samples sharing greater molecular similarity with tumors
that were grouped in different histological categories
[19]. The authors found substantial molecular diversity
even within each major subtype and an association with
patient survival. In another series, exome, transcriptome,
and copy number alteration data were collected from
167 primary renal tumors that included oncocytomas,
pRCC, chRCC, and translocation subtypes. In pRCCs, variants
in genes were significantly associated:
MET
,
NF2
,
SLC5A3
,
PNKD
, and
CPQ
.
MET
mutations occurred in 15% of the pRCCs
analyzed and included previously unreported recurrent
activating mutations. Variants in
TP53
,
PTEN
,
FAAH2
,
PDHB
,
PDXDC1
, and
ZNF765
were significantly associated with
chRCCs. Gene expression analysis identified a five-gene set
that allows classification of chromophobe, papillary, and
oncocytoma subtypes. RNA sequencing also identified
previously unreported gene fusions, such as
ACTG1-MITF
fusion, which leads to cellular transformation and expres-
sion of downstream target genes. Upregulation of
BIRC7
, an
antiapoptotic factor, in MiTF-high RCC tumors suggests a
potential therapeutic implications for BIRC7 inhibitors
[18] .Papillary RCCs are the second most commonly encoun-
tered subtype in RCCs and has traditionally been subdivided
into two types based on light microscopy
[2]. The TCGA
consortium molecularly characterized 161 pRCCs, using
whole-exome sequencing, copy number analysis, messen-
ger RNA/microRNA sequencing, DNA methylation analysis,
and proteomic analyses. Type 1 tumors were associated
with
MET
alterations, and gain of chromosomes 7 and 17,
whereas type 2 tumors were characterized by
CDKN2A
silencing,
SETD2
mutations,
TFE3
/Xp11.2 fusions, and
increased expression of the NRF2-antioxidant response
element pathway. Interestingly, within type 2 pRCC, further
subgroups could be distinguished on the basis of molecular
[(Fig._1)TD$FIG]
Fig. 1 – Pathways driving most subtypes of RCCs converge on nutrient- and/or oxygen-sensing pathways in the renal cell. Pink circles indicate proteins
whose genes are mutated in rare kidney cancers (RKCs), and clear circles indicate genes mutated in clear-cell RCCs. RCC = renal cell carcinoma.
E U R O P E A N U R O L O G Y 7 2 ( 2 0 1 7 ) 9 7 4 – 9 8 3
977